Running — Part 2: How a Machine Learning model allows me, through an API, to level my runs

Recently, I did an exploratory analysis of my runs using data exported from the Nike Run Club app, and it helped me make better decisions in sport. I ran more, now having a better understanding of my training performance. All of this provided me insights that I decided to do more: I trained a model that clusters my runs and built an API that allows me to, with each new run, query this model to understand the "level" this run is, based on all my other runs.
Introducing
As I already knew my data because the EDA I had done, the first step was to train the model. My goal was to find patterns in my runs, and once I found these patterns, I wanted to segment them in groups with different characteristics, so that, with each new run, I could identify which of these groups it would be included in.
There are many clustering algorithms, and like any other machine learning problem, there isn't the best approach. To simplify the selection process, in addition to experimentation, we must take in consideration some factors, as the characteristics of the clusters, the features of the dataset, and possible outliers.
In this case, I was familiar with my data in space and believed that one of the famous clustering algorithm could work well: K-Means. Without going in too much details, K-Means is an algorithm that groups data in k clusters with same variance, minimizing inertia (sum of squared distances of samples to the nearest cluster center). However, like any other algorithm, it also has its limitations, and we need understand them in the evaluation process.
In short, the algorithm begins randomly generating k centroids (central points of clusters), to which each record is assigned based on the centroid with the smallest distance (forming a cluster). After that, the model calculates the average values of the points in each cluster and uses this value to reposition the centroids. This process is repeated until the positions of the centroids converge or a specified stopping criterion is met. In other words, as I wrote above, the goal of this task is to choose centroids that the inertia is minimized. It's important to note that as the initialization step is random (a non-deterministic algorithm), we should to execute multiple initializations with different centroid seeds to find the best result.
As it's not the purpose of this post to address deeply about clustering algorithm, I take this opportunity to provide the entire documentation in scikit-learn. Additionally, you can find a great post on some of these algorithms in practice at this link.
The model
As I have already realized data exploration step, I will go straight to training the model.
Always remembering that in the preprocessing step, the features need to be resized to the same scale, what we call standardization. This process rescales the data to the set has a mean close to 0 and a standard deviation close to 1, optimizing the learning of distance-based algorithms. For this, I used the StandardScaler() function.
Regarding the algorithm, the K-Means doesn't "decide" the ideal number of clusters. We need to do that, and I used a simple technique: Elbow Method. When we increase the number of clusters, the inertia decreases, meaning the distance from each point to its nearest centroid becomes smaller. What we need is this distance as small as possible, as we need the optimal point that minimizes the number of clusters and the variance in each cluster.
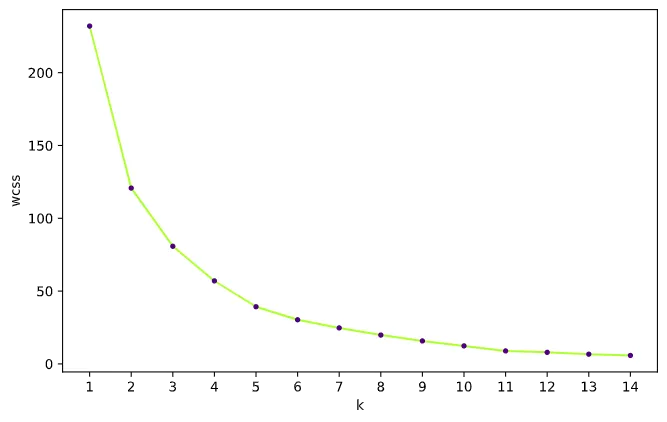
The plot above is a plot of inertia (within-clusters sum-of-squares - wcss) when we increase k. The "elbow" point indicates a kind of trade-off between error and the number of clusters, meaning when the wcss no longer significantly decreases with each iteration, and there aren't no substantial gains with an increase in k. For my problem, 5 would be the optimal number of k, but just to confirm, I used a package called kneed, that finds the point on the line where the curvature is maximum.
knl = KneeLocator(n_cluster, wcss, curve="convex", direction="decreasing")
knl.elbow
According to the documentation, inertia can be recognized as a measure of how internally cohesive the clusters are, but it has some disadvantages:
Inertia makes the assumption that clusters are convex and isotropic, which is not always the case. It responds poorly to elongated clusters, or manifolds with irregular shapes.
Inertia is not a normalized metric: we just know that lower values are better and zero is optimal. But in very high-dimensional spaces, Euclidean distances tend to become inflated (this is an instance of the so-called “curse of dimensionality”). Running a dimensionality reduction algorithm such as Principal component analysis (PCA) prior to k-means clustering can alleviate this problem and speed up the computations.
Knowing the optimal number of clusters, I can adjust the model to the data:
km = KMeans(n_clusters=5, n_init=30, random_state=1)
km.fit(X)
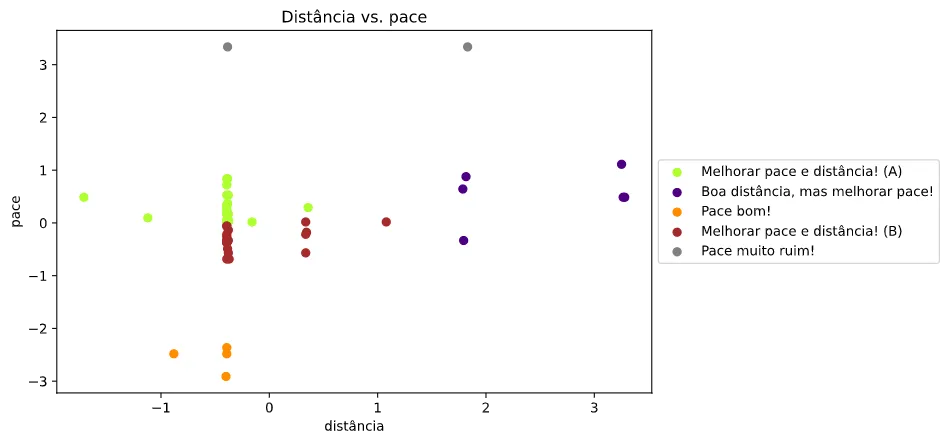
With the trained model, I plotted a graph with the distance vs. pace of my races, already segmented in their respective interpreted clusters:
Finally, I saved:
- The trained model;
- The scaler;
- A dict with cluster labels.
Building the API and making requests
To build the API I used Flask, a micro framework for web development and written in Python. It's very lightweight, simple to use and so much used for building Rest APIs.
Creating the file.py
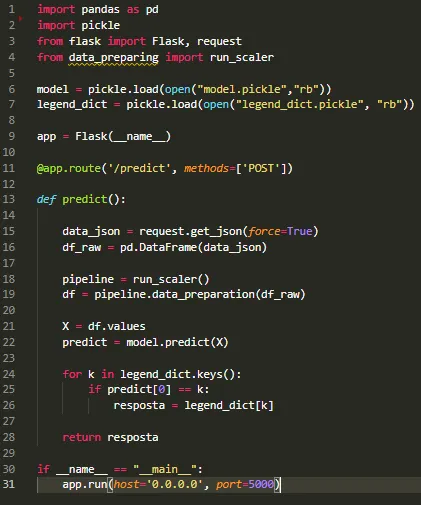
1) Import of the necessary libraries and modules. I also imported the data_preparing.py file that I created in class format, which contains all the necessary transformations that the data needs for prediction;
2) Loading of the model and labels that were exported in the training process;
3) Assigning Flask in the variable app;
4) Creation of the endpoint that bring the prediction using the data passed through POST, which has been added to the variable 'data_json';
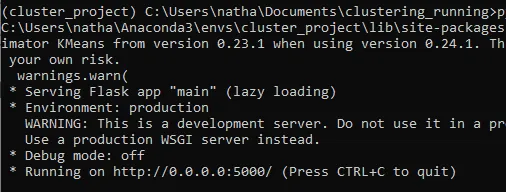
5) Initializing the Flask that will receive requests on port 5000, running locally.
With file.py ready, just start it in the terminal:
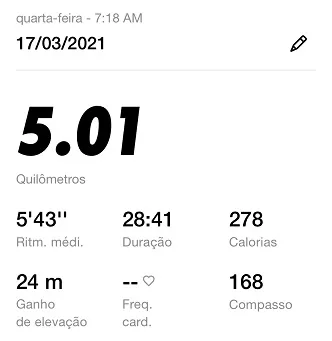
To test it I will use Postman, a tool that allows to run API tests and make requests in general. To do this, I will take a data from some run that wasn't used in model training:
On Postman:
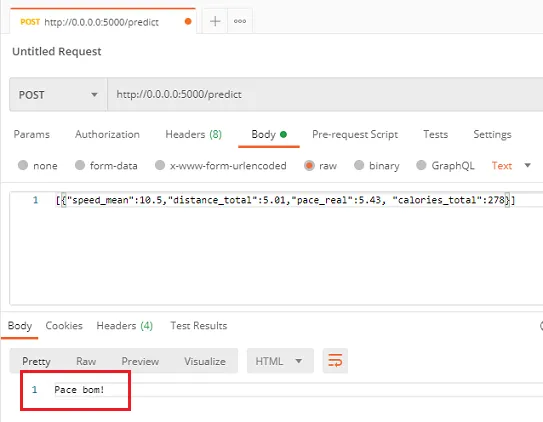
At this moment, the model's response wasn't a surprise to me, because I knew my information (my sample of runs was small). However, as my dataset grows, it becomes a bit out of control, and that's where modeling shortens the paths. Another example of how a machine learning model can help us in real life.
The complete analysis code can be found on my github.
References
https://scikit-learn.org/stable/modules/clustering.html#k-means
https://realpython.com/k-means-clustering-python/
https://medium.com/data-hackers/como-fazer-uma-api-rest-para-modelos-de-m-l-com-flask-e-documenta%C3%A7%C3%A3o-swagger-7e74bfa19137
Enjoy Reading This Article?
Here are some more articles you might like to read next: