In this post, we will analyze the evolution of the teams in the Women's World Cup, comparing the performance of the main teams in the 2019 and 2023 World Cups. The teams analyzed will be: Spain, the current champions; England, the current vice-champions; the United States, champions in 2019 and Sweden, who finished third in the last two editions.
Retrospect
Spain
After winning the 2023 World Cup, Spain have established themselves as one of the best teams in international football. With an excellent campaign in the last edition, they won the title in a final against England (these two teams were the subject of the first post of our series).
In 2019, though, Spain's situation was very different. With fewer established players and without several of the young players who made a difference in 2023, such as Salma Paralluelo, Spain got through the group stage via goal difference, with a below-average campaign (1W, 1D, 1L). In the round of 16, they were eliminated by the United States, winners of that edition.
England
England have performed well in the last two World Cups. In 2019, they finished in fourth place, losing to Sweden after losing in the semi-finals to the United States, who won that edition. In addition, as we mentioned, England are the current vice-champions of the world, defeated in the final by Spain.
In 2019, despite falling into a tough group with Japan, Argentina and Scotland, they didn't face much difficulty and came out on top with 3 wins in 3 games. In the knockout stage, they were only defeated in the semi-finals 2-1 in a match against the United States.
United States
At the 2019 World Cup, the United States won their fourth world title (they also won 1991, 1999 and 2015), their second in a row, in a final against Netherlands. In this edition, the US broke a record that still stands today: the team with the most goals in a World Cup (26!).
However, at the 2023 World Cup, the United States were eliminated in the round of 16 in a penalty shootout against Sweden. This campaign can be considered frustrating and was marked by a big decline in the performance of the United States attack (we'll see why in the following analysis).
Sweden
Sweden has done well in recent World Cups. In 2019, they won third place, having eliminated strong teams like Germany and Argentina in the knockout stage. In this edition, Sweden only lost to the two finalists: the United States (in the group stage) and the Netherlands (in the semi-final).
In 2023, Sweden repeated their 2019 campaign and managed to win third place again. This time, they only lost one match (against champion Spain in the semi-final) out of the seven they played. In the match for third place, Sweden beat Australia 2-0.
Comparison of World Cup campaigns
In this section, we will analyze the teams using different scatter graphs. The idea is to be able to compare both the evolution (or decline) of a team from one Cup to the next, as well as a general comparison between all the campaigns of the teams mentioned so far.
Passes and Progression
First, it's important to mention that we've updated our definition of progressive action compared to the last post.
Definition of progressive passing: Actions in the first 30% of the pitch are ignored. They must reduce the distance from the ball to the center of the opponent's goal by at least 20%. Only successful passes that are completed closer to the opponent's goal vertically or that have their end point inside the opponent's penalty area are counted.
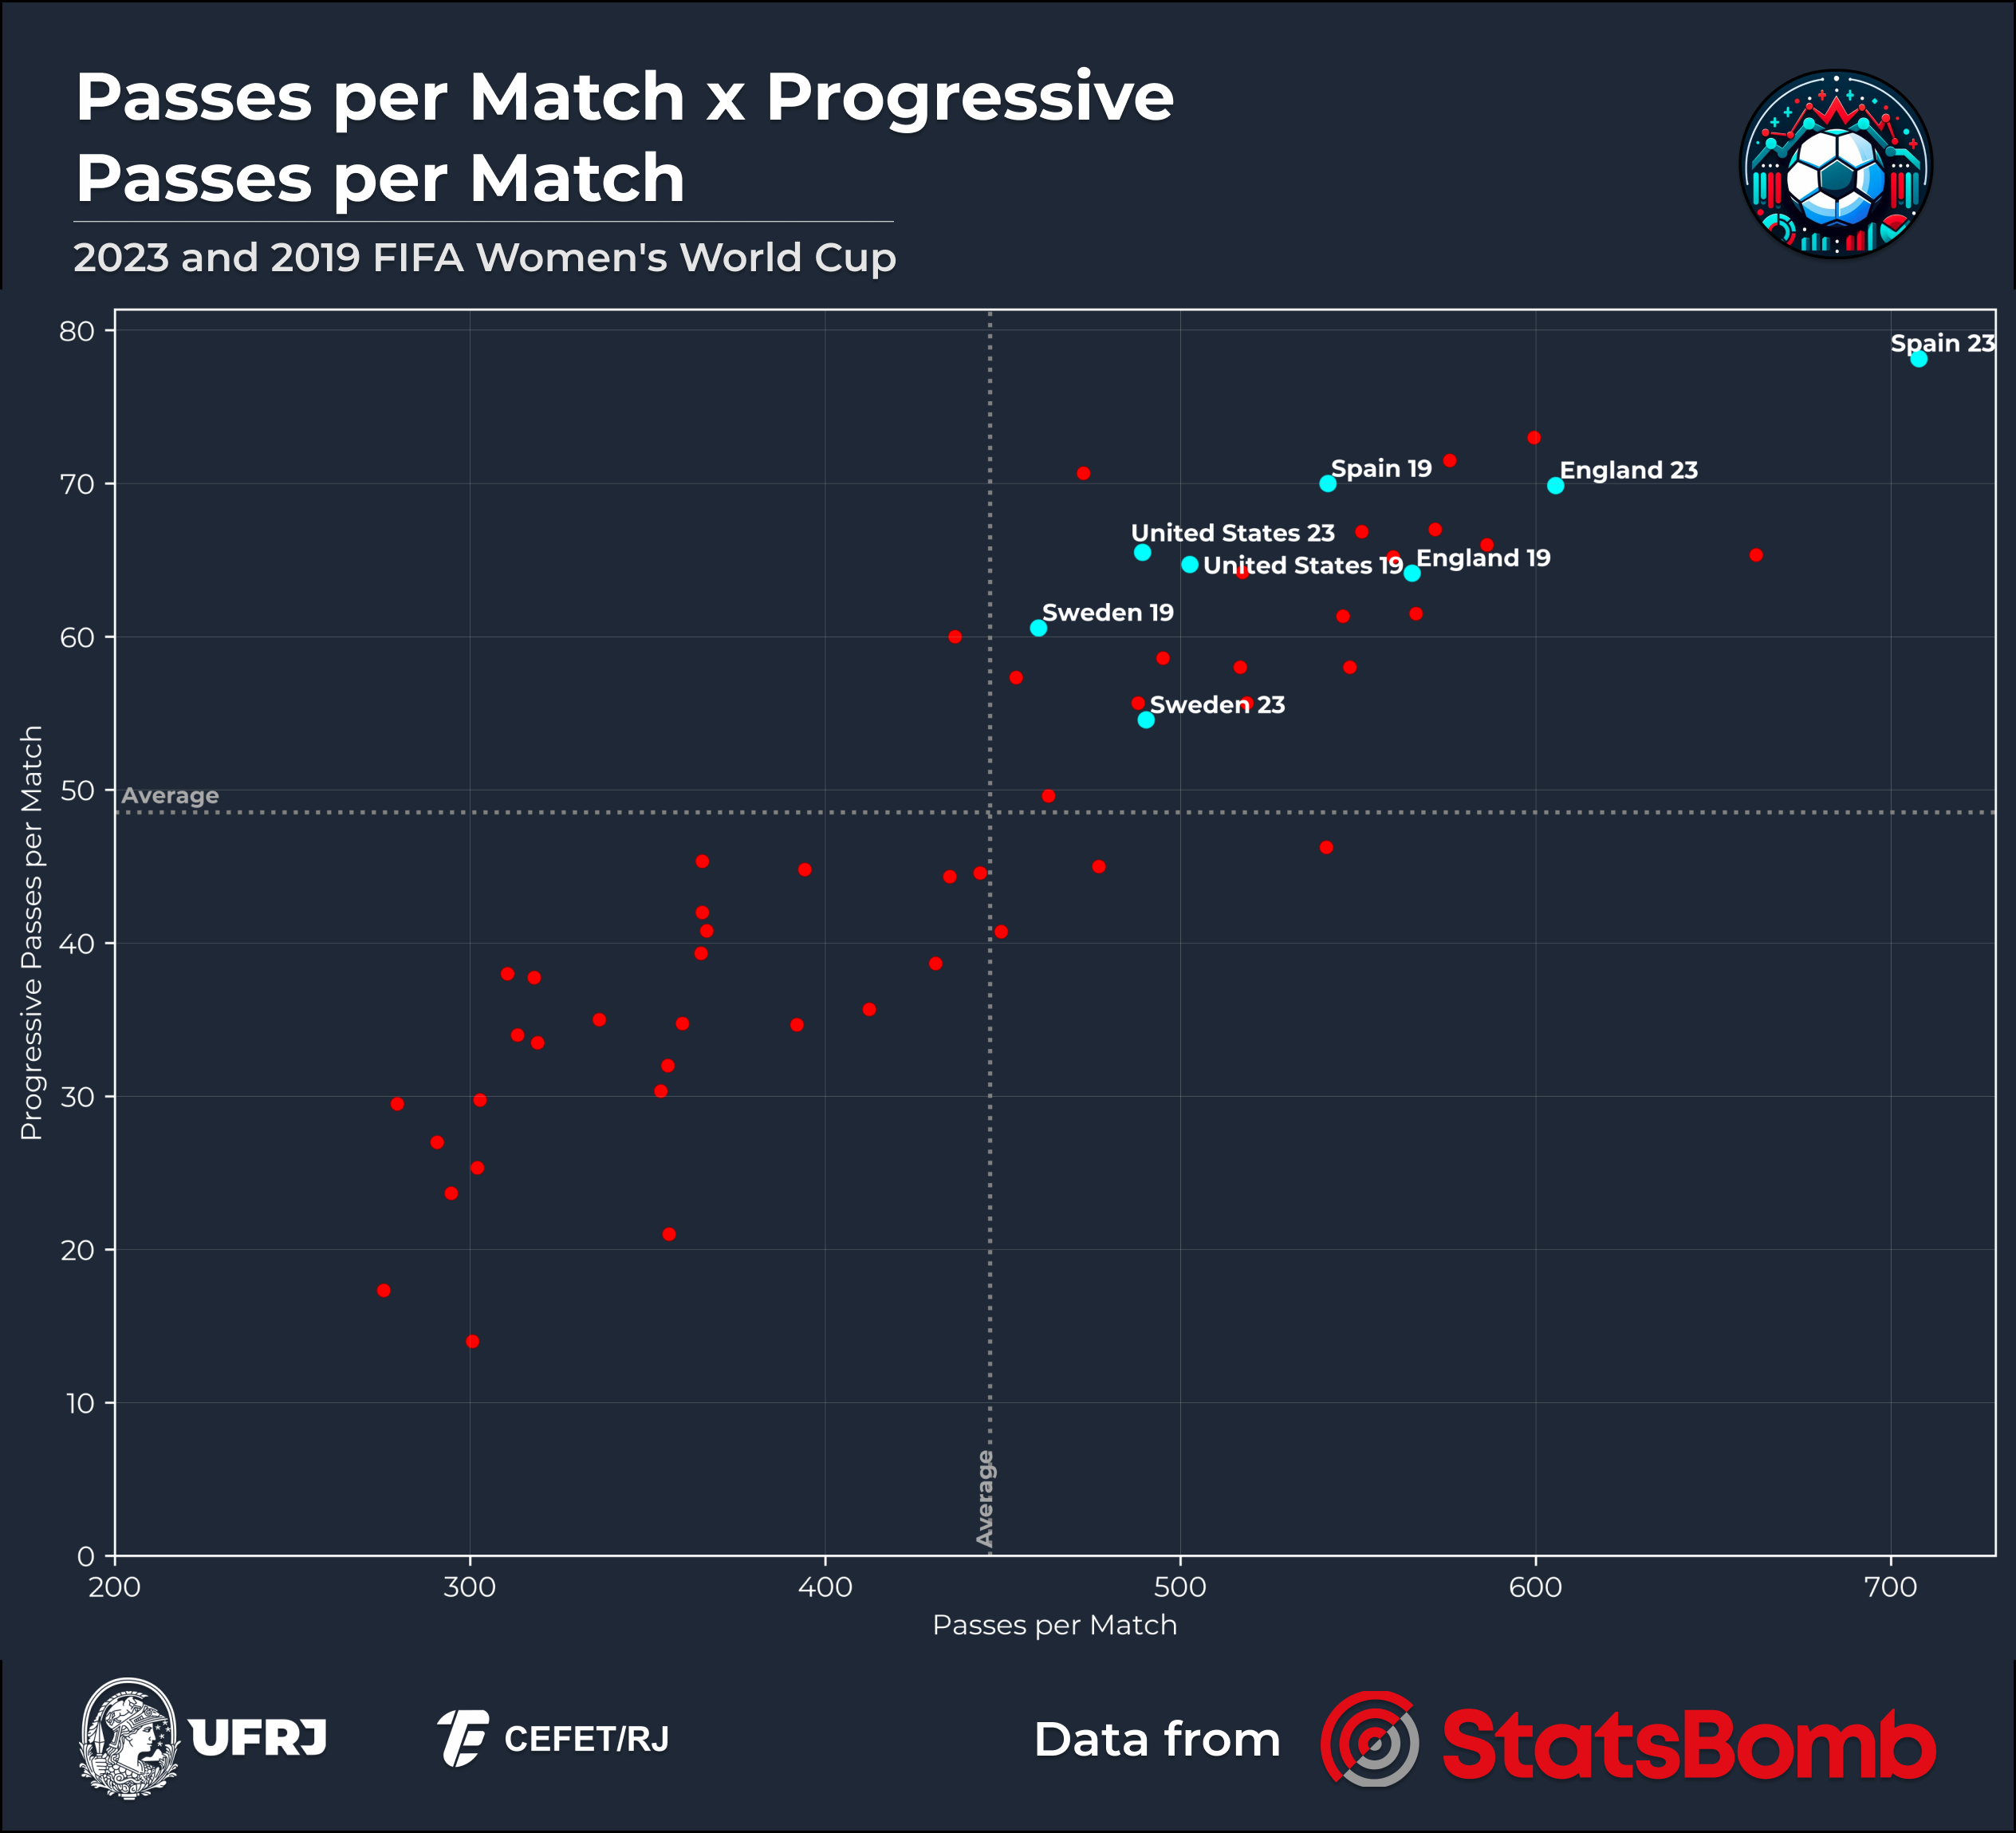
Graph showing passes per match and progressive passes per match
Looking at the passing and progression of these teams, there are a few points to highlight:
- It's important to highlight the difference in the amount of passes per game made by Spain in the two campaigns, with Spain 2023 being by far the team with the most passes and progressive passes out of all the teams that played in the two World Cups. This is a clear consolidation of the style of play based on passing, possession and pressing that is implemented in both the women's and men's national teams.
- All of these teams (consolidated on the national team scene) began to pass more in the transition from one World Cup to the next, with the exception of the United States. This may be a trend in women's international football: passing and proposing the game are key factors for success.
Shots and Expected Goals
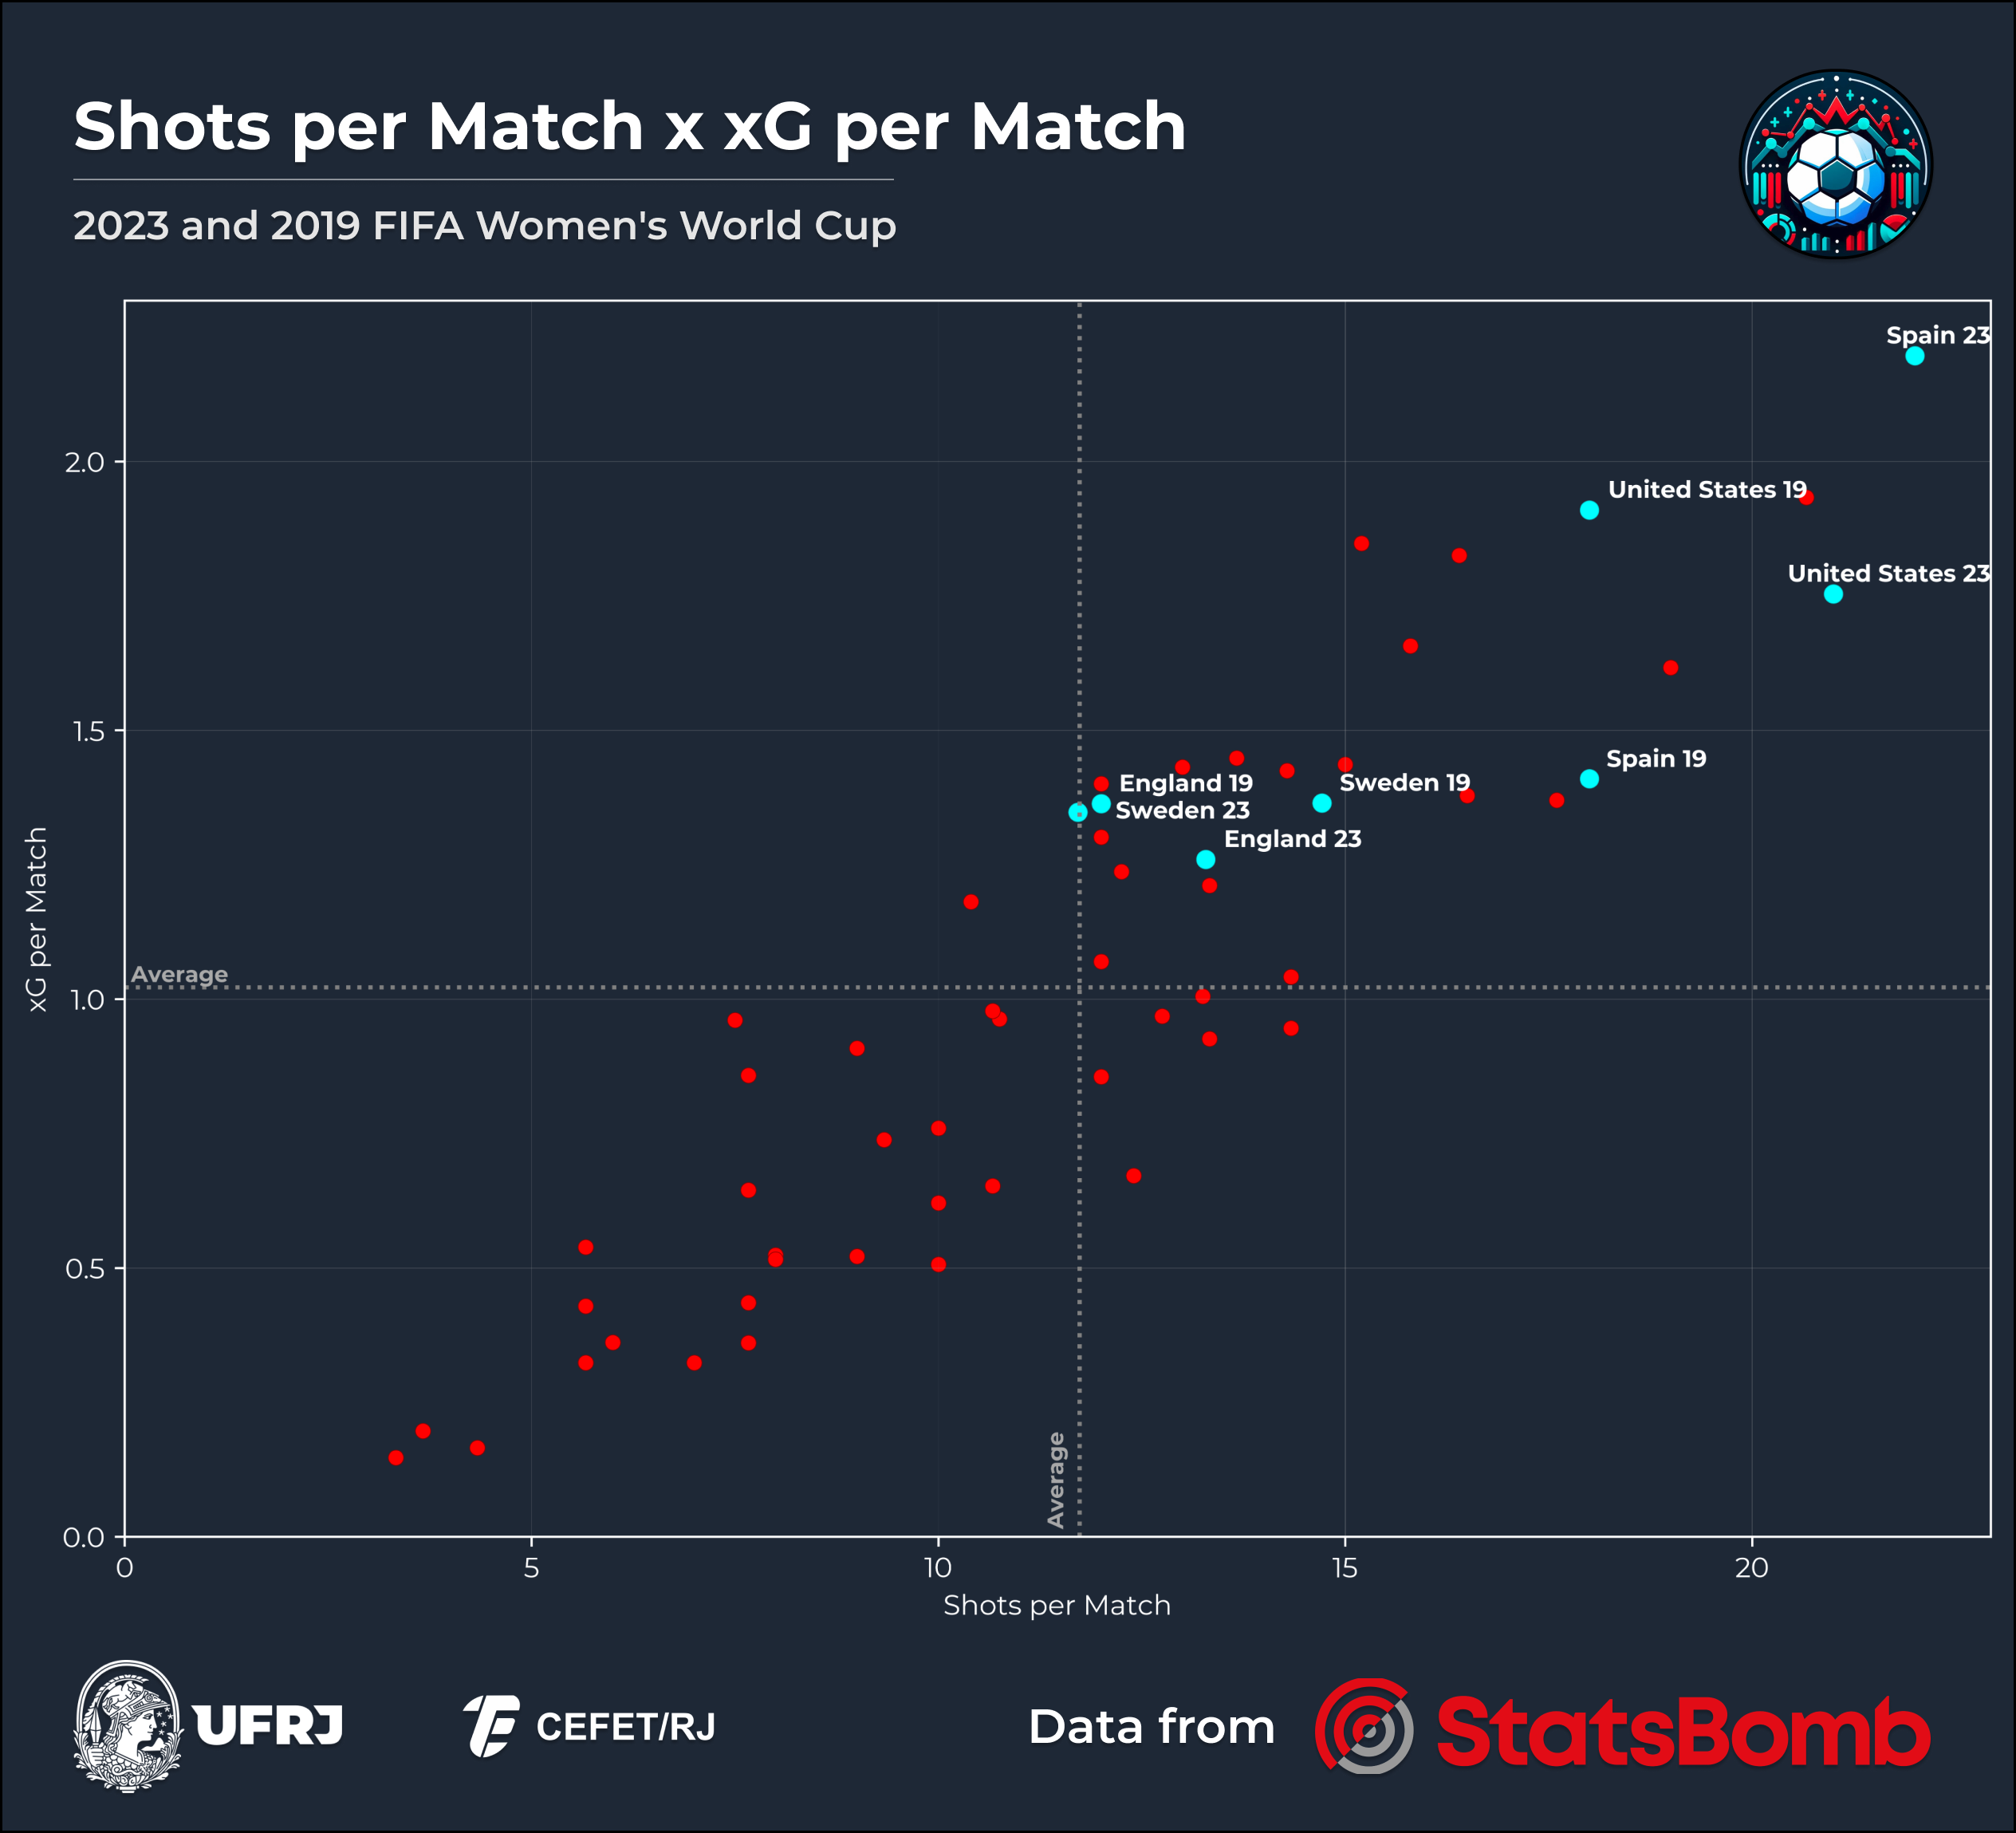
Graph showing shots per match and expected goals per match
In this graph relating the number of shots per match to the xG accumulated per match ( excluding penalties), we have the following observations:
- Once again, Spain's evolution deserves to be highlighted. The team has made considerable improvements in attack, becoming the team with the most shots and expected goals of all teams in the last two World Cups.
- Despite a reasonable increase in shots, the United States had a decrease in their xG compared to 2019, indicating that the team has, on average, decreased the quality of its scoring opportunities. In addition, the team's attacking efficiency has also decreased dramatically. Disregarding penalties, the 2019 United States had a positive balance of +8.63 (!!!) in the difference between goals and xG. In 2023, the balance was -3.01.
- The England team of 2023, despite being a highlight in terms of the number of passes and progressive passes, doesn't have the same impact when it comes to finishing moves. Among the teams compared, they have the fewest xG per game (1.26), reinforcing what we said in our first post when we commented that England 2023 had a very methodical style of play. Even with a good capacity for progression, the team doesn't take many shots and, consequently, doesn't accumulate many expected goals compared to the other top teams.
Final Considerations and Conclusion
Throughout this post, we've focused on comparing teams that are well-established on the women's football scenario (perhaps the least well-established of these is Spain in 2019, a fact that only magnifies their winning campaign in 2023). So it was only natural that all the teams, even with differences in play and style, would be “well placed” in the graphs shown. At least in the two graphs shown, the prediction actually came true, with all 8 teams being above average in the 4 metrics used.
This concludes another post in our series on the 2023 Women's World Cup, and the fourth post will be the last in the series. Stay tuned for future posts!
Enjoy Reading This Article?
Here are some more articles you might like to read next: