In this post, we're going to analyse the Brazilian national team's campaigns in the last two World Cups. The aim is to find out whether or not there has been any kind of evolution in the Brazilian team, and to understand what level the team was at in those competitions, both in the global and continental context. To do this, we're going to compare Brazil with the teams featured in the last post (Spain, the United States, Sweden and England) and with other South American teams (Argentina, Colombia in 2023, Chile in 2019).
Overview
2019 World Cup
At the 2019 World Cup, the Brazilian team was seeded in a group with Australia, Italy and Jamaica. Their performance in the group stage was good: 2 wins in 3 games, scoring 6 goals and conceding 3 during the first phase. Despite their good run, Brazil progressed to the knockout stage in third place after a triple draw in Group C (the place was won on the basis of the best third-placed team).
In the Round of 16, Brazil faced France in a very tight game. Despite a balance in possession during regulation time, the Brazilians had 12 shots, while the French had 5. The match was only decided in the second half of overtime, when France scored the winning goal and ended Brazil's participation in the competition.
2023 World Cup
At the 2023 World Cup, Brazil had an even shorter and more frustrating campaign. Once again, the Brazilian team finished third, now in Group F, which included France, Jamaica and Panama. The Brazilians won one and drew one in three games, but in this edition, only the top two teams in the group qualified for the knockout stage.
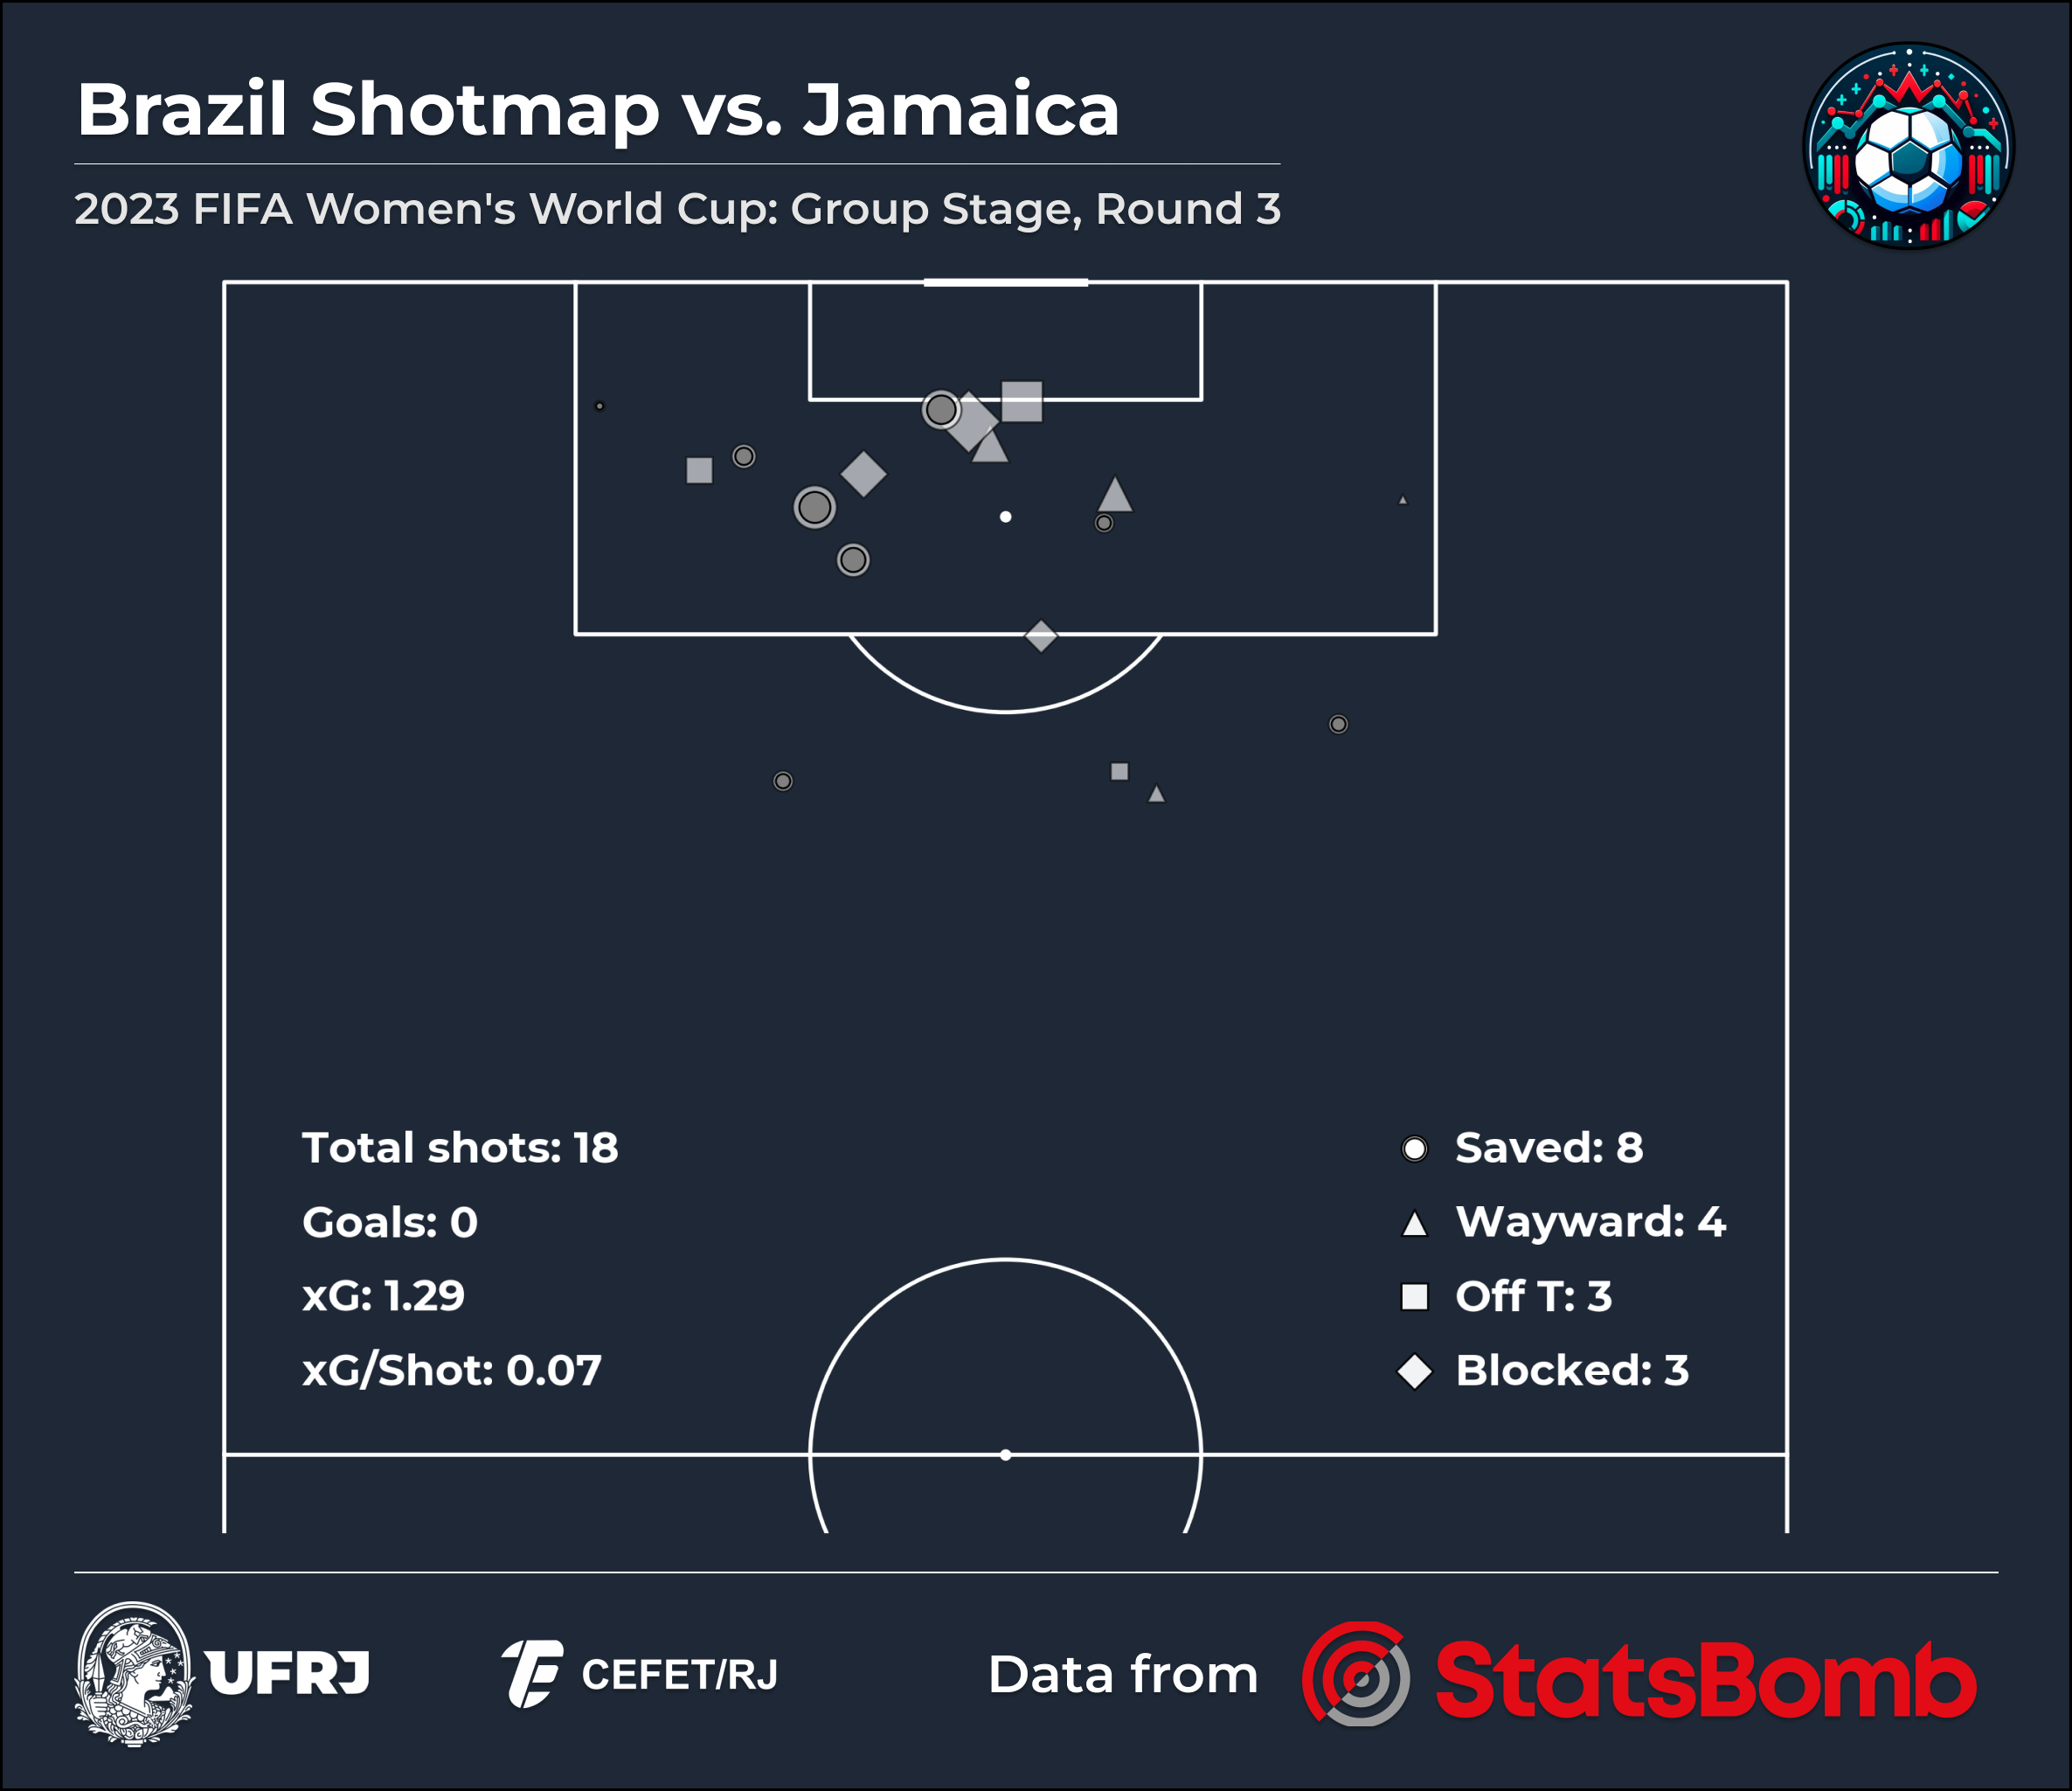
When we say that the campaign was frustrating, it was not for nothing. On the final matchday of the group stage, Brazil only needed a simple win against Jamaica, an opponent who qualified with a single goal against Panama (who conceded 11 in the competition). In theory, qualification seemed on course. In practice, Brazil, despite a giant dominance when we analyse possession, the number of passes and shots, were unable to make satisfactory use of the many chances that were created. The result could not have been any other: 0-0, and the Brazilian team was eliminated in the first phase of the competition.
Statistics between Cups
In this section, we're going to analyse Brazil's participation using different scatter plots. The idea is to be able to compare both the evolution (or regression) from one World Cup to the next, as well as a general comparison between the campaigns of other teams.
Before starting the analyses and comments section, we have to say that, because the World Cup is a short tournament (and, unfortunately, the Brazilian team's campaigns even shorter), some matches end up having a big impact on the metrics shown below. This context must be taken into account when analysing.
Passes and Progression
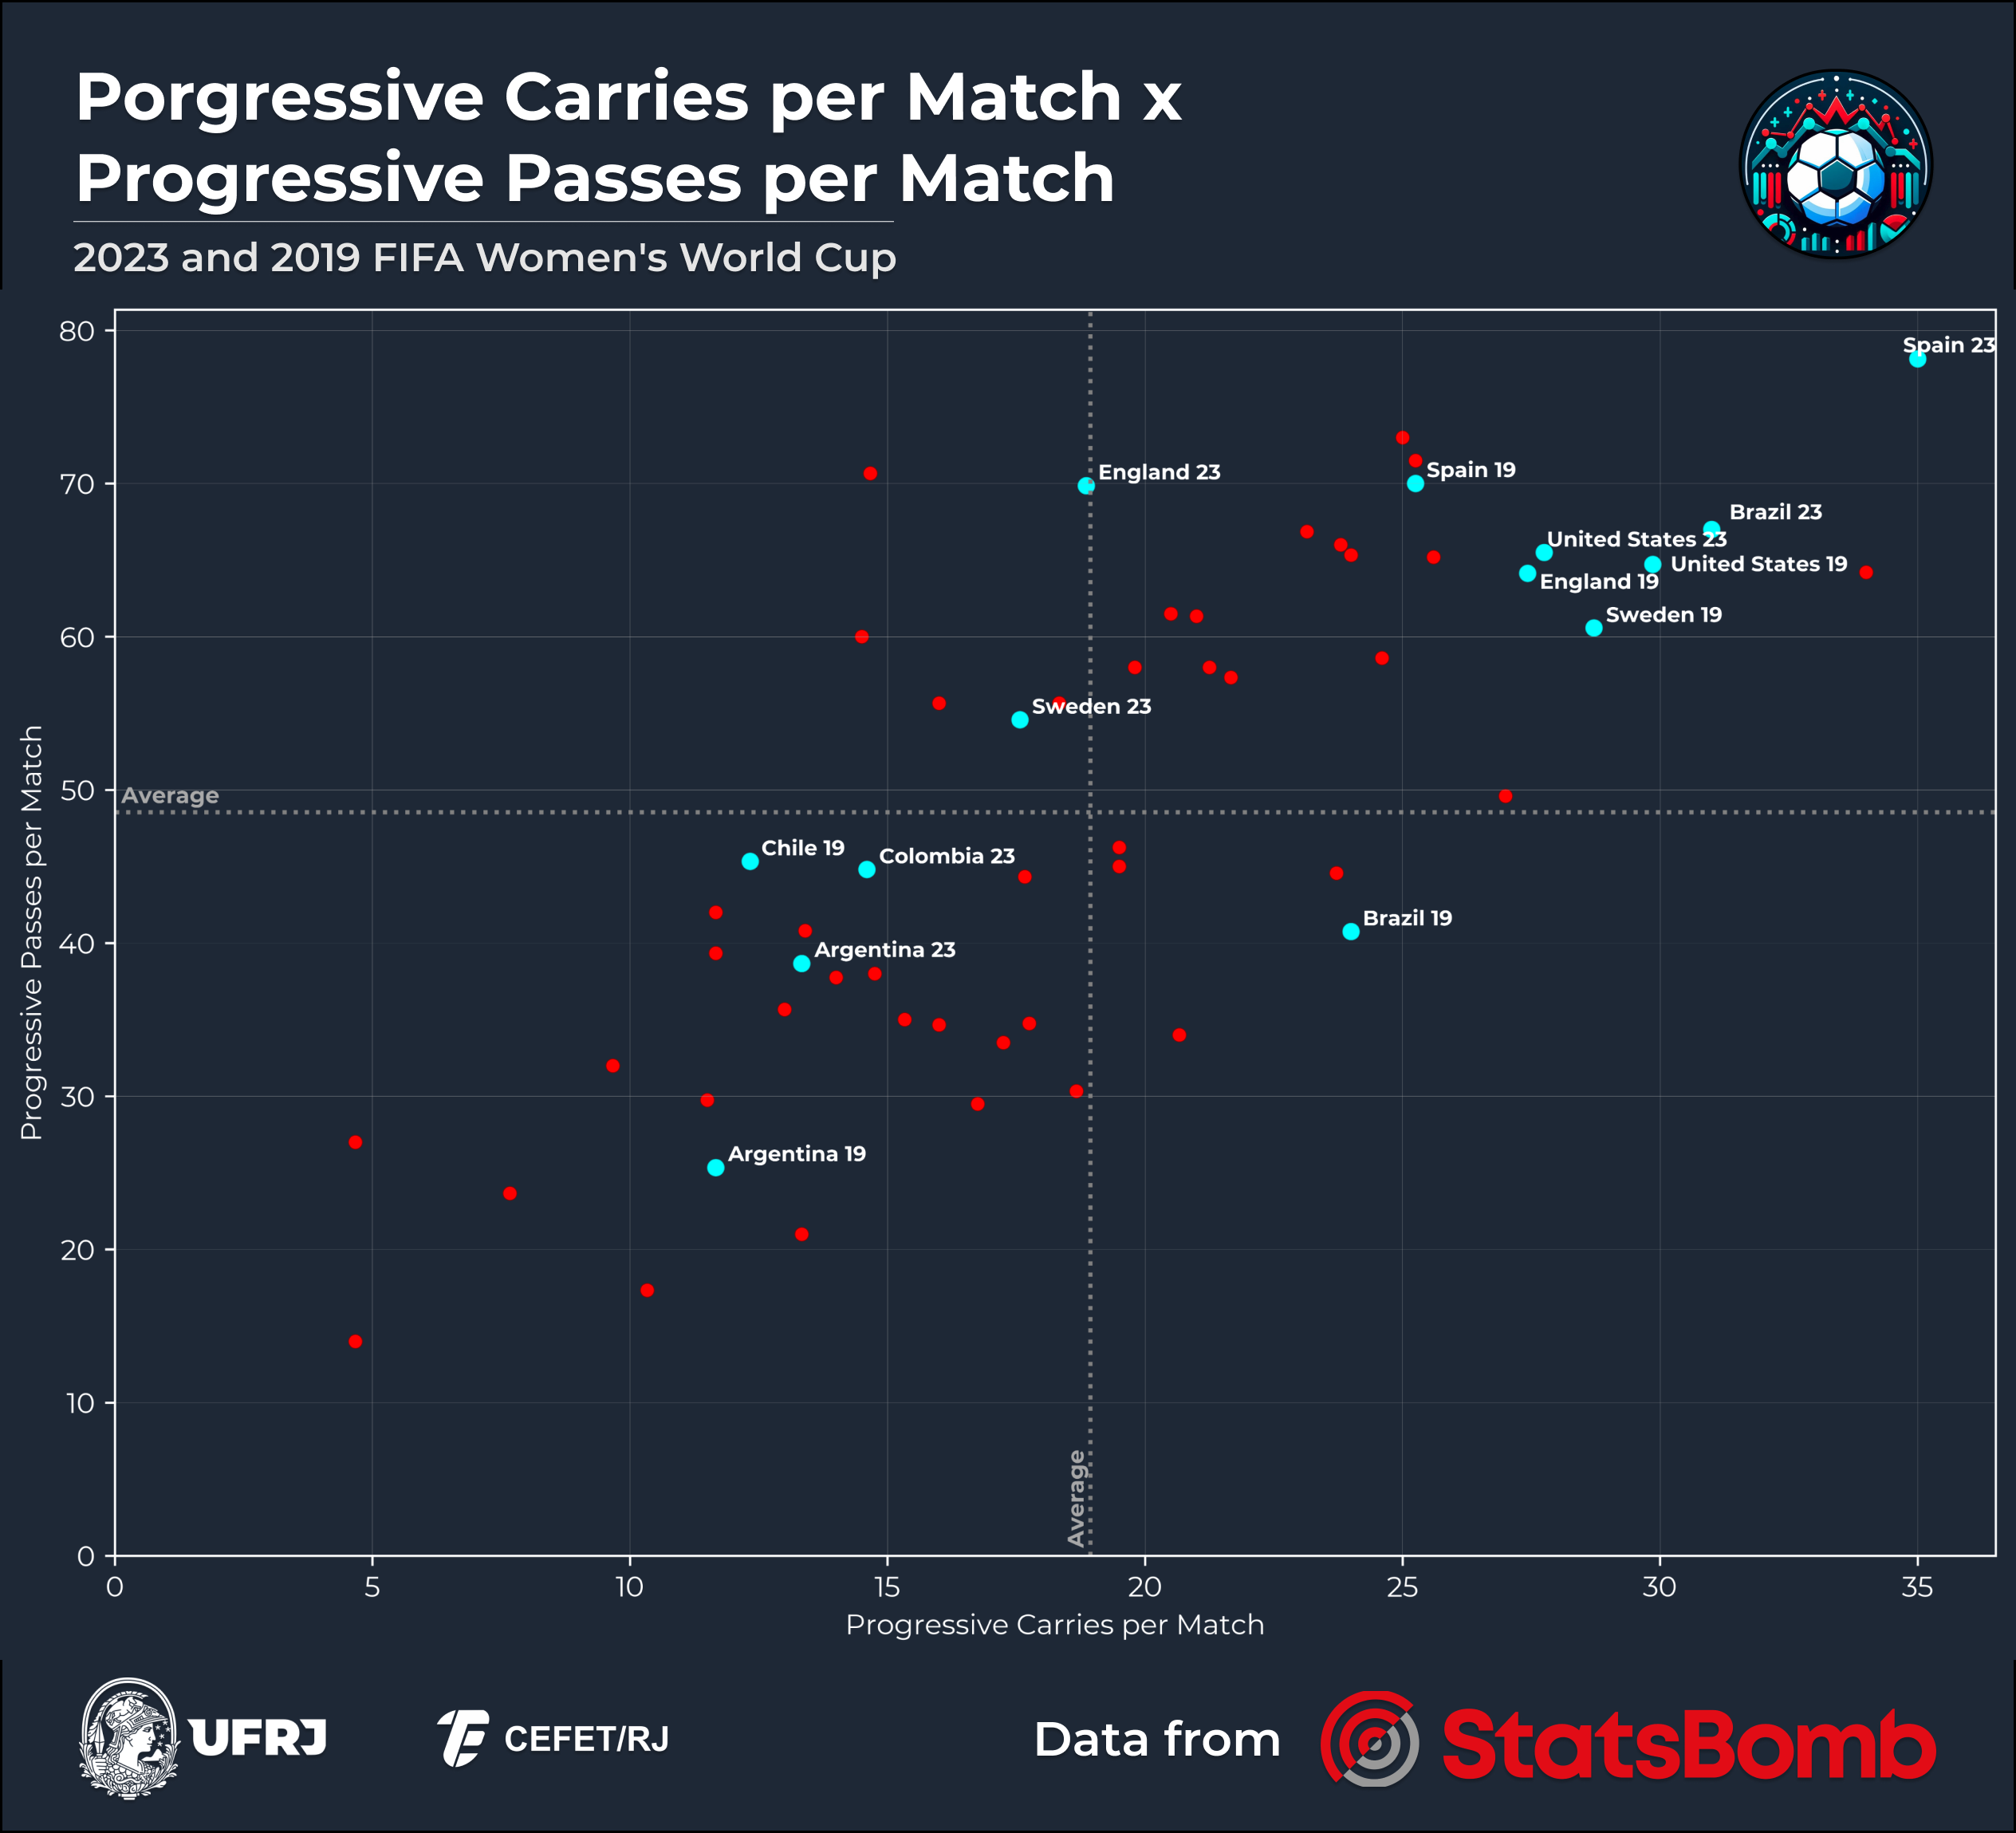
Analysing the passes and progression of the 2019 Brazilian team, you can see the low number of progressive passes per match, which is considerably below average. In 2019, the team made an average of approximately 40 progressive passes per match, about 20% less than the average of the other teams. Furthermore, there has been a noticeable improvement from the 2019 World Cup to the 2023 World Cup, with Brazil being one of the best teams in this regard.
- Brazil's opponents in South America are not well placed on the graph, either in relation to the main European teams or in relation to Brazil.
- In 2023, Brazil improved in both aspects, with around 30 progressive drives and almost 70 progressive passes per game, revealing a significant evolution, with the team assuming a more aggressive and progressive profile on the pitch compared to the much less offensive behaviour of the team in 2019. In the 2019 campaign, Brazil made approximately 20% fewer progressive passes than the average of the other teams.
Shots and xG per shot
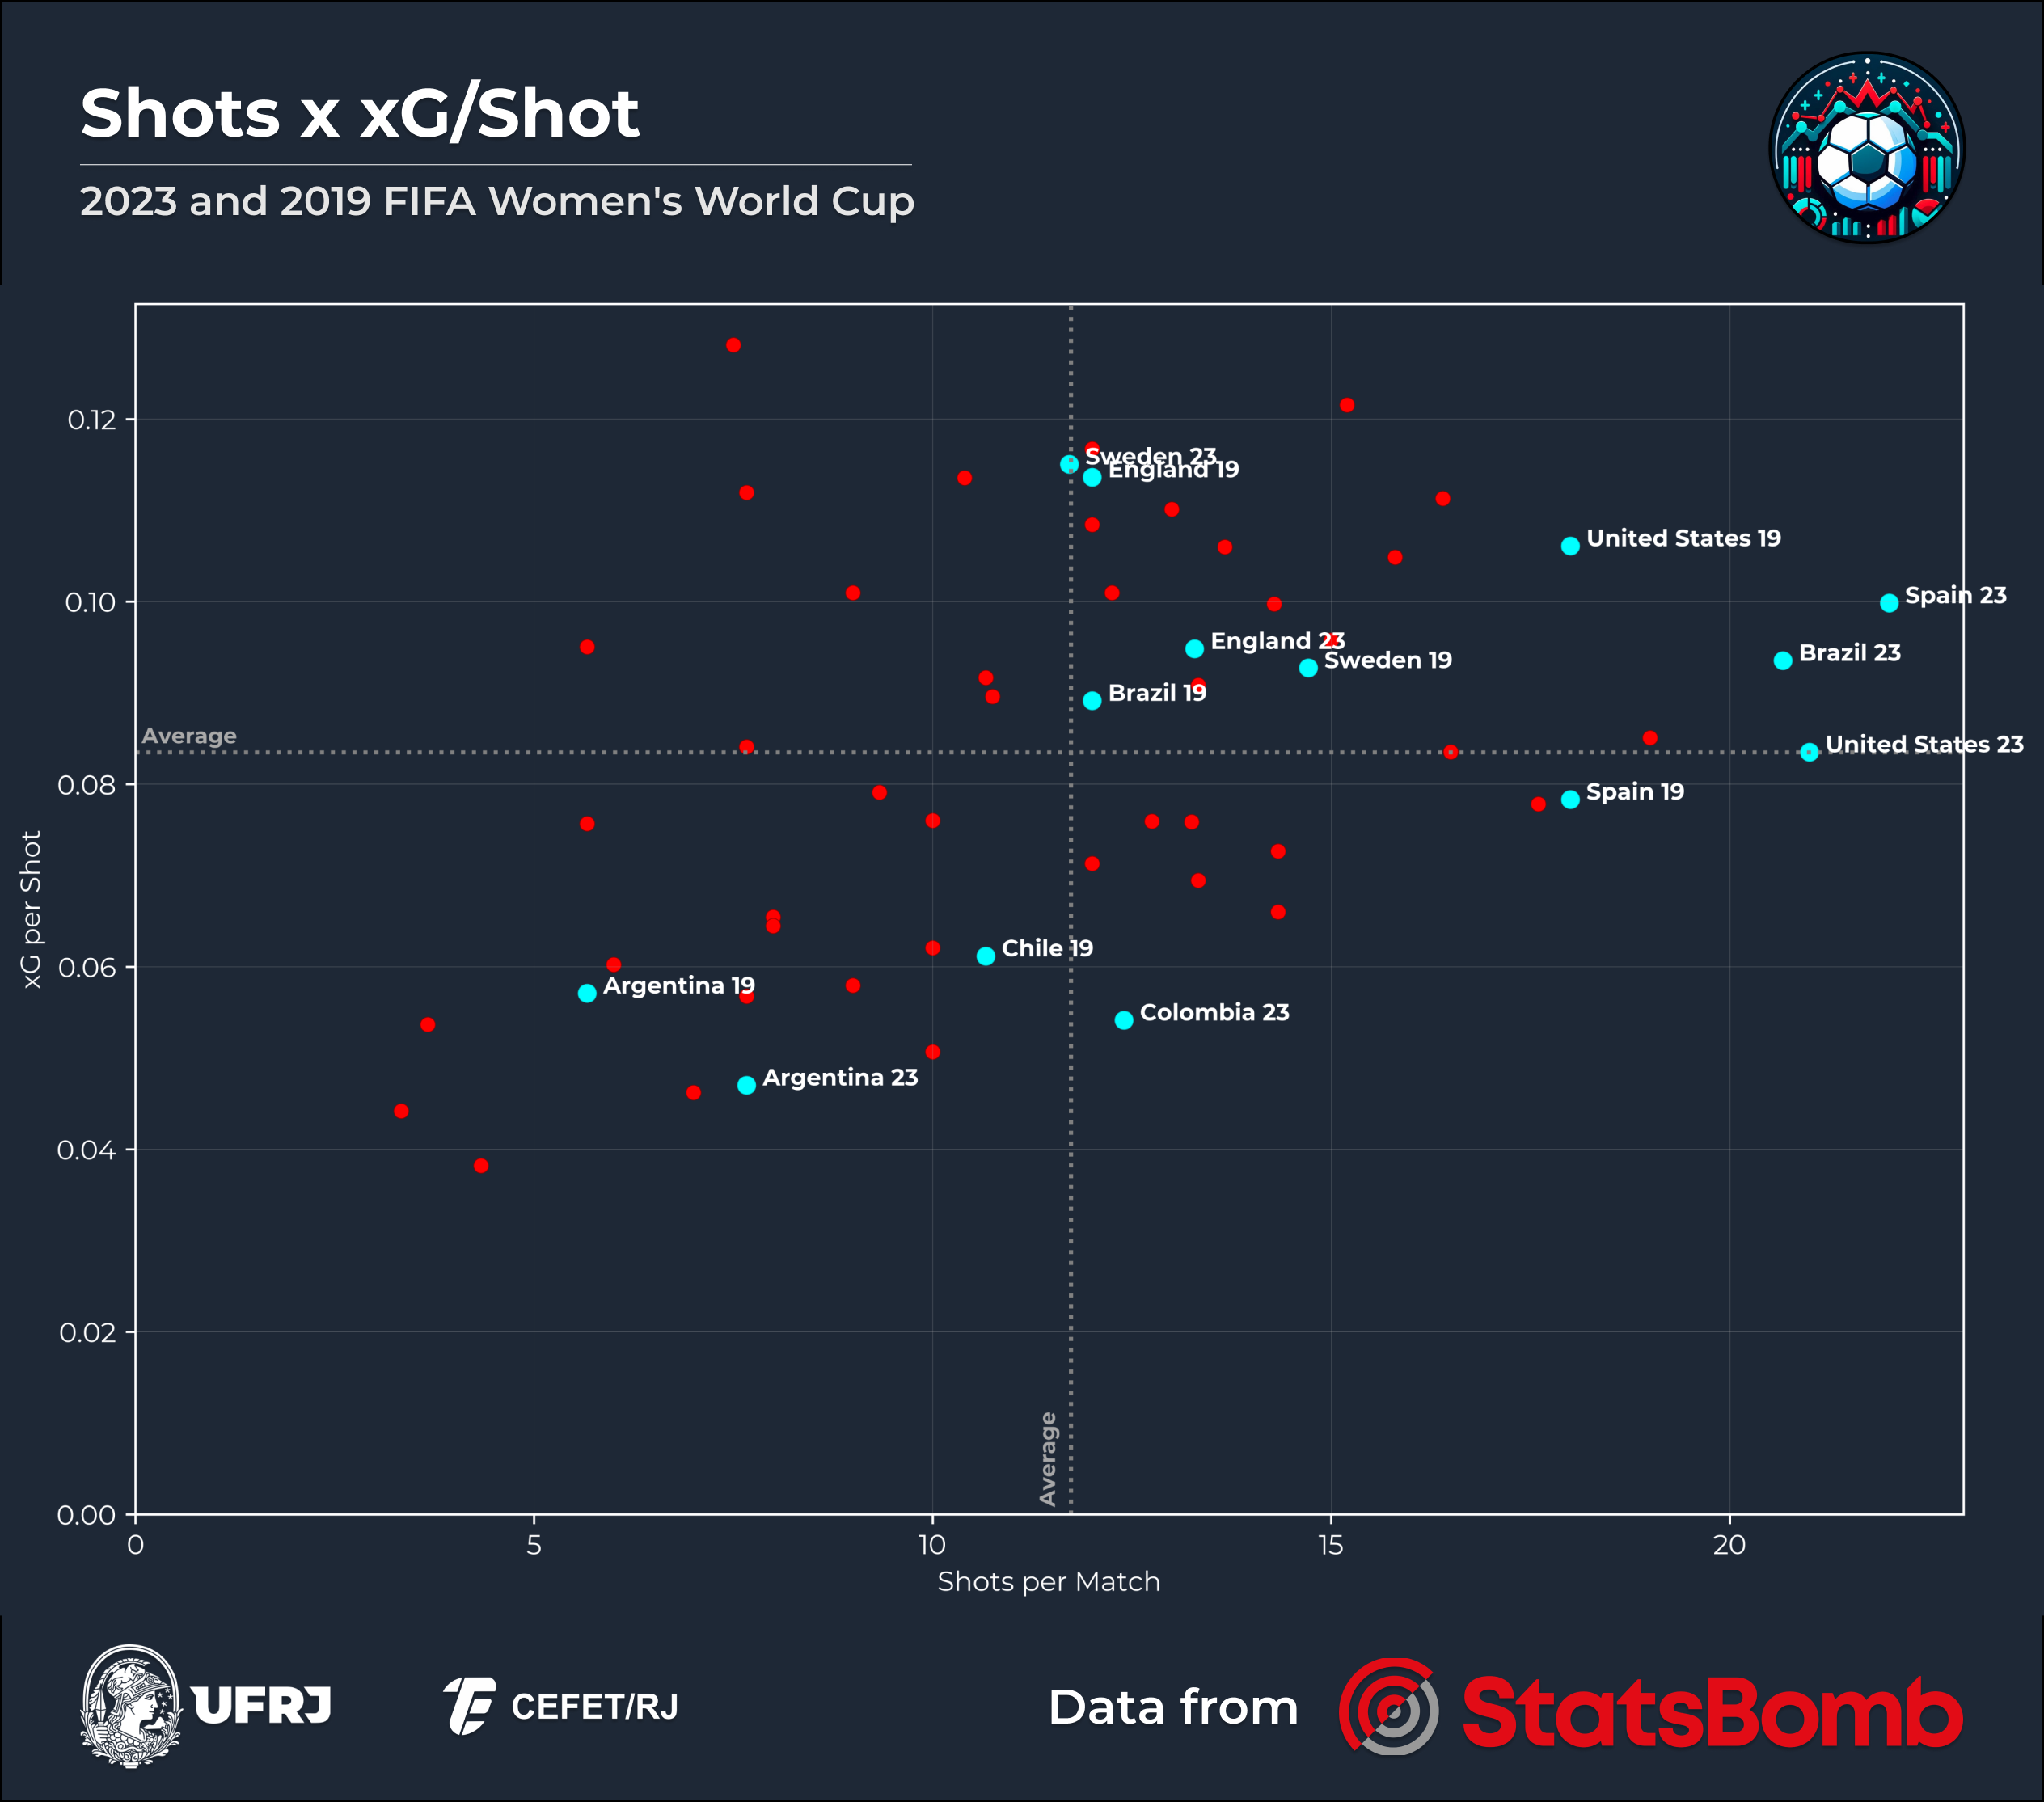
To analyse the quality of the teams' shots, we'll use the graph of shots per match vs. xG per shot.
- Once again, Brazil are better placed than their South American opponents, indicating that there is a big advantage for the Brazilian national team on their continent.
- Despite a much higher number of shots per match in 2023, Brazil have not seen a considerable improvement in the quality of their chances (expected goals per shot). The lack of progress in this area was, as we said, a determining factor in Brazil's elimination in the group stage.
- As we've already mentioned, the fact that the World Cup is a short tournament means that some matches have a big impact on the statistics. In this graph, we have a clear example of this in the number of shots that the Brazilian national team produced. In the second round of the group stage, against Panama, Brazil shot 33 times, scoring 4 goals on the occasion. This number of shots is greater than the sum of the shots in the other two matches, showing that the match against Panama creates a false impression that the Brazilian team had the characteristic of shooting often, but that this was an isolated episode in the competition.
Final considerations and conclusion
The graphs show that Brazil have had considerably better campaigns than their rivals in South America, but their main opponents in Europe and North America (who have a much more established national women's football scene) still have a big advantage.
Even though the campaigns analysed were short and, in some ways, disappointing, Brazil made great progress after 2023. In 2024, the Brazilian team, now led by coach Arthur Elias, won the silver medal at the Olympic Games in Paris, revealing important new players to the team, such as goalkeeper Lorena and defender Tarciane.
And so ends our series of posts analysing the 2023 Women's World Cup. Stay tuned, there's lots more to come!
Enjoy Reading This Article?
Here are some more articles you might like to read next: