In this series of posts, we will explore some methods to predict football clubs' winning percentage. In this first post, we will discuss two statistics: the winning percentage and a variation of it called the Pythagorean expectation. The data used will be from the latest seasons of major European leagues (23-24) and the Brazilian league (24), extracted from the FBREF website.
What is the Pythagorean Expectation?
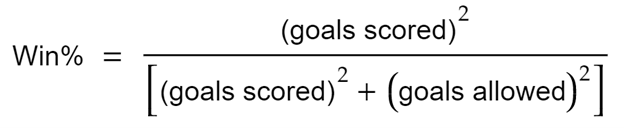
The Pythagorean expectation is an analytical formula initially used in baseball. It was created by Bill James, a renowned statistician and pioneer in sports data analysis, who wrote dozens of books studying baseball through statistics to determine why teams win or lose. This formula aims to estimate the percentage of games a team should have won based on the number of runs they scored and allowed. In football, the equivalent would be goals scored and goals conceded.
The name of the statistic comes from the similarity of its formula to the Pythagorean theorem.
Comparing a team's winning percentage with its Pythagorean expectation can help evaluate which teams are performing above expectations and which are underperforming.
The Research
The data used consists of a table with all match results from each league's season, collected from FBREF.
Data Preparation and Defining Percentages
After extracting the data and performing basic table cleaning, the result is a DataFrame in the following format. A season consists of 380 matches, and to calculate the winning percentage and the Pythagorean expectation, we need the following information: the match result determines the team's winning percentage, while goals scored and conceded define the Pythagorean expectation.
This is the way the data is extracted from FBREF.
We separated each team's goals and determined the winner of each match. This allows us to calculate the winning percentage—where a win is worth 1, a draw is worth 0.5, and a loss is worth 0. The sum of these values is then divided by the number of games played (Wikipedia).
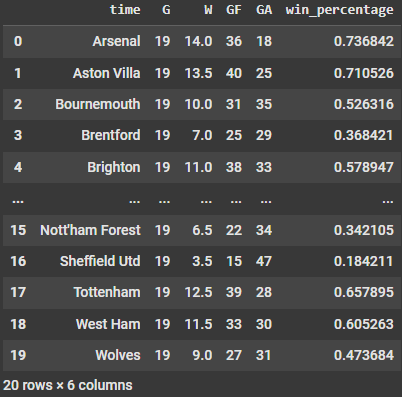
After adjusting the table and calculating the teams' winning percentages, we split the data into the First Half and Second Half of the season, meaning before and after matchday 20. The table for the First Half of the season looks like this:
G: Number of matches played; W: Win value, used for calculating the winning percentage; GF: Goals scored; GA: Goals conceded; wpc: Winning percentage
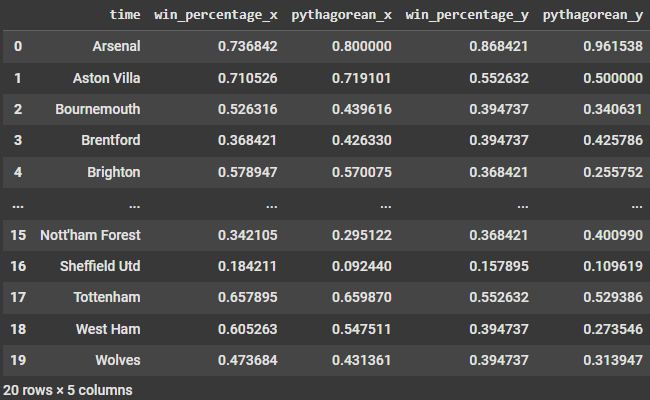
To finalize our table, we calculate the Pythagorean expectation and merge the First and Second Half tables according to each team.
Values with x refer to the First Half, and values with y refer to the Second Half.
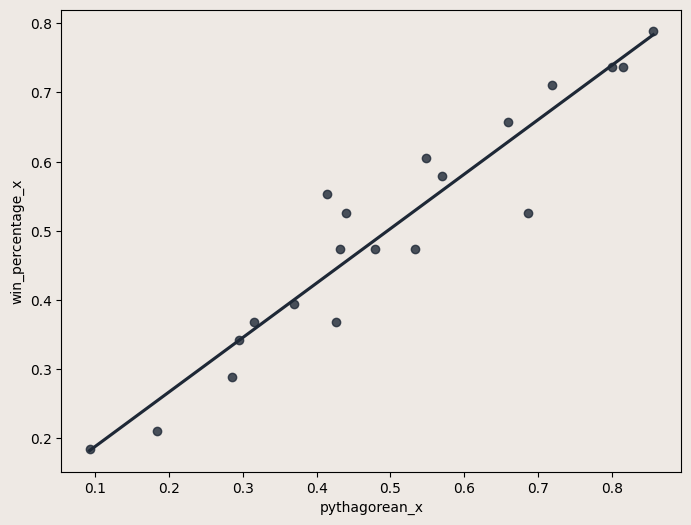
As seen in the image below, the Pythagorean expectation in the first half of the Premier League is strongly related to the winning percentage, as expected.
The relationship between pythagorean_x and win_percentage_x in the First Half is represented in the graph. The line represents a linear regression fitted to the data, showing the relationship between the two variables.
But what we really want to know is: which of these statistics has a stronger relationship with a team’s winning percentage at the end of the season? To analyze this, we can generate a correlation table comparing these statistics between the First Half and Second Half of the season.
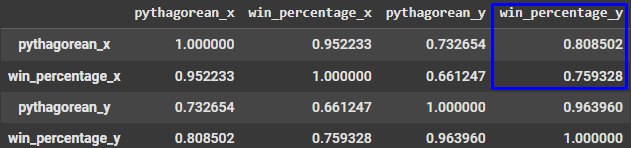
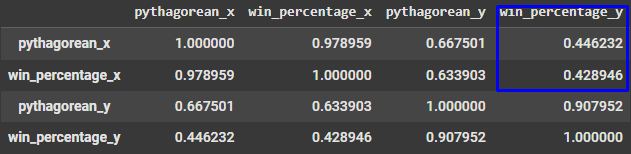
Premier League correlation table.
As seen in the highlighted values, pythagorean_x has a stronger correlation with win_percentage_y (0.80) than win_percentage_x with win_percentage_y (0.75). While this difference is small, it suggests that the Pythagorean expectation has slightly better predictive power than the winning percentage. This is the result for the Premier League. What about other leagues?
Bundesliga
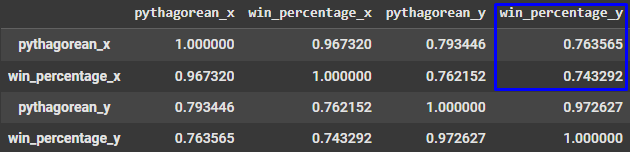
Bundesliga correlation table.
La Liga
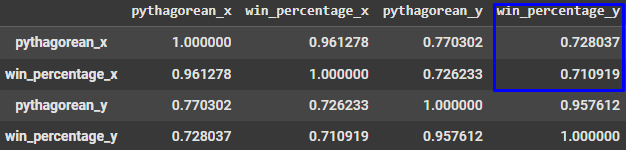
La Liga correlation table.
Serie A
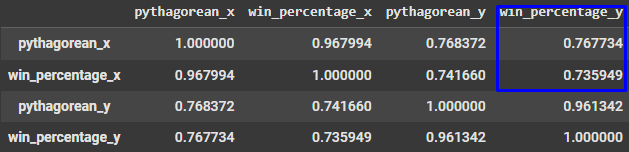
Serie A correlation table.
Ligue One
Ligue One correlation table.
As observed, in the German, Spanish, and Italian leagues, the values are slightly lower, but the Pythagorean expectation still has better predictive power than the winning percentage. In the French league, despite the correlation between First Half and Second Half results being below 50%, the Pythagorean expectation still outperforms the winning percentage. So far, everything aligns with expectations. However, things get interesting when we analyze the Brazilian league.
Brasileirão
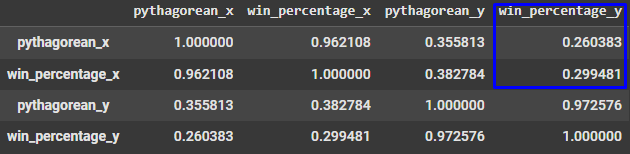
Brasileirão correlation table.
In the Brazilian league, not only do First Half values have less than 30% correlation with Second Half results, but the winning percentage also has a higher correlation than the Pythagorean expectation! This is the only one of the six leagues studied where this phenomenon occurs.
Conclusion
Based on the experiment’s results, we decided to analyze how much team performance fluctuates between the two halves of the season, depending on the league, to better understand the most ‘unpredictable’ leagues. To do this, we calculated the mean and median of this variation across all studied leagues. The Brasileirão stood out as the competition with the highest fluctuation between halves, surpassing European leagues. Surprisingly, La Liga showed a relatively high variation for European standards.
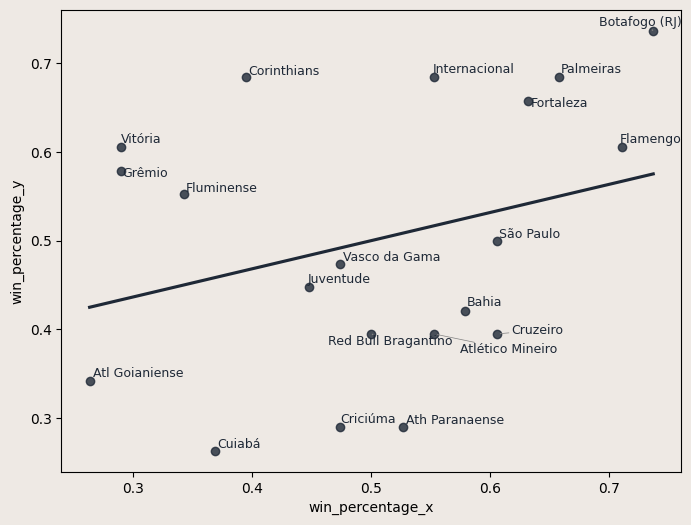
variation in Brazilian clubs’ performances between the First and Second Halves of the Brasileirão.
The graph above illustrates the high variation in Brazilian clubs’ performances between the First and Second Halves of the Brasileirão. Teams like Vitória, Grêmio, Fluminense, and Corinthians had poor results in the first half but above-average performances in the second half. Meanwhile, Atlético Mineiro, Cruzeiro, and Bahia performed well in the first half but declined in the second. Why does this happen?
We can speculate on some possible reasons, such as increased investment over time, frequent coaching changes, or fan pressure after poor results, which forces club management to invest more in reinforcements. However, determining the real cause would require a more in-depth study on the subject.
In the next post, we will discuss predicting outcomes based on the clubs' market value, which will be our primary variable. Stay tuned to our social media channels so you don't miss any updates from the blog!
Enjoy Reading This Article?
Here are some more articles you might like to read next: