In this final post of the Results Prediction series, we’ll introduce the Poisson Distribution. This time, we’ll do something a bit different: we’ll explain what the Poisson Distribution is and walk through the step-by-step process of predicting the final score of a match.
The Poisson Distribution
The Poisson distribution is a discrete probability distribution that expresses the probability of a given number of events occurring in a fixed interval of time or space. It assumes these events occur with a known average rate and independently of the time since the last event.
The Poisson distribution formula.
The left side of the Poisson distribution formula, P(X = k), represents the probability of exactly k events occurring in a fixed interval. Here, X is the number of events, and k is the specific number we’re interested in.
The numerator on the right-hand side, e-λ λk, has two components. λk reflects the likelihood of k events happening based on the average rate λ. The e-λ accounts for the randomness of the events, ensuring that the probability decreases as the number of events deviates from the expected rate.
The denominator on the right-hand side, k!, adjusts for the number of ways the k events can occur. The factorial notation calculates the number of possible arrangements, ensuring that the probability accounts for the fact that the order of events doesn’t matter.
How to Use It in Football
First of all, we need to clarify something: there are several goal prediction models using the Poisson distribution, but we’re going to use the simplest one, which considers only the historical match data of the two teams. More complex models can account for other variables such as pitch quality, head-to-head records, and more.
To begin, we need to decide which matches we want to predict. For this post, we’ll try to predict the number of goals in a Fla-Flu derby (with Fluminense as the home team) in 2023, using data from both teams from the 2022 Brasileirão season.
Preparing the Table
We used the results of all matches from the 2022 Brasileirão, sourced from the FBREF website. The data includes various pieces of information, but we only used the match results. For the next steps, we had to split the data into “Home Team,” “Away Team,” “Home Goals,” and “Away Goals.”
Calculating Offensive and Defensive Strength
To predict the number of goals for a team, we first need to calculate the Offensive Strength and Defensive Strength of the teams in the Brasileirão, based on last season.
The Offensive Strength is the average number of goals scored by each team, both at home and away. The formula is:
Total goals scored at home / number of games
Total goals scored away / number of games
In the 2022 Brasileirão season, there were 534 home goals and 371 away goals. Divided by the number of games (380), we get the average goals scored at home as 1.405, and the average goals scored away as 0.976.
The Defensive Strength is the average number of goals conceded by each team — which is essentially the inverse of Offensive Strength, since the number of goals scored by the home team equals the number of goals conceded by the away team. Thus, the average goals conceded at home is 0.976, and the average goals conceded away is 1.405.
Now we can use these league averages to calculate the strengths of the specific teams we want to analyze.
Predicting Fluminense’s Goals
To calculate Fluminense’s Offensive Strength, we take the number of home goals scored by Fluminense in the 2022 season (39) and divide it by the number of home games (19) = 2.052. Then we divide this value by the league’s average home goals (1.405), giving us an Offensive Strength of 1.460.
Next, we calculate Flamengo’s Defensive Strength to predict how many goals Fluminense might score. We take the number of away goals conceded by Flamengo (24) and divide it by their number of away games (19) = 1.263. Then divide this by the average away goals conceded in the league (1.405), yielding a Defensive Strength of 0.898.
Now we can compute the expected number of goals for Fluminense by multiplying: Fluminense’s Offensive Strength (1.460) × Flamengo’s Defensive Strength (0.898) × Average Home Goals (1.405)
1.460 × 0.898 × 1.405 = 1.845
Predicting Flamengo’s Goals
To calculate the number of goals Flamengo might score, we use the same formulas, but replace the average home goals with average away goals.
Now, multiply these values with the average away goals:
1.239 × 1.078 × 0.976 = 1.305
Using the Poisson Distribution
Since no match ends in a score of 1.845 to 1.305, we use these values with the Poisson Distribution to spread 100% of the probability across possible goal outcomes for each team. We want to estimate the chance of each team scoring a specific number of goals (in our case, 0 to 5) — the number of occurrences of the event — using the expected goals (1.845 for Flu, 1.305 for Fla) - the expected occurencies.
We can do this easily in Python using the command:
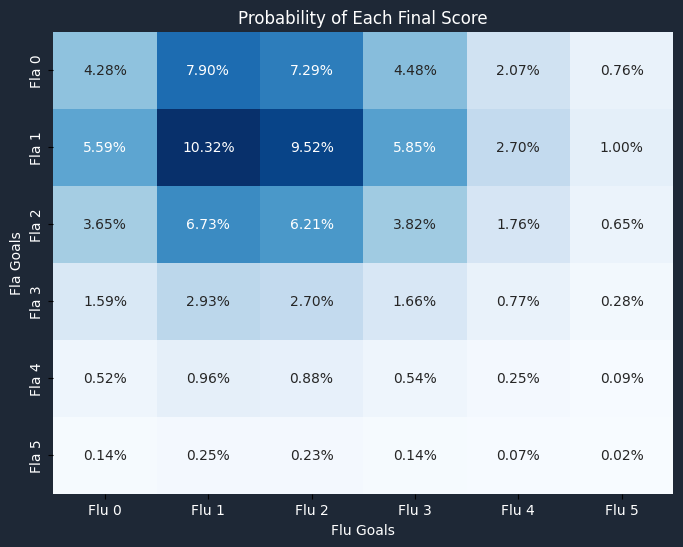
Calculating this 6 times for each team, we get the following vectors:
Goals
Fluminense
Flamengo
0 goals
15.80%
27.11%
1 goal
29.15%
35.39%
2 goals
26.90%
23.09%
3 goals
16.54%
10.05%
4 goals
7.63%
3.28%
5 goals
2.82%
0.86%
Since these results are independent, the most likely result of the match is 1-1, as both teams are most likely to score 1 goal. Multiplying the probabilities of each team scoring 1 goal gives the probability of a 1-1 draw:
0.2915 × 0.3539 = 0.1031
Using the np.outer command with these two vectors, we can generate the full probability matrix of all possible score combinations.
By summing the probabilities: Above the diagonal (Fluminense wins): 48.96% On the diagonal (Draw): 22.75% Below the diagonal (Flamengo wins): 26.91%
Conclusion
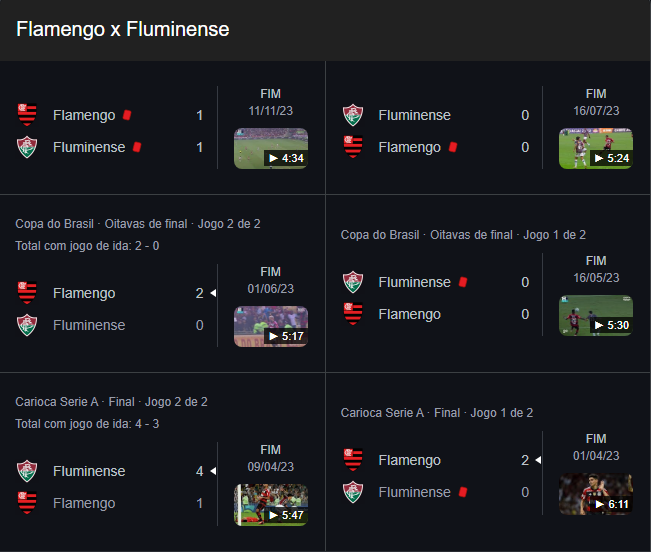
In total, we had 3 draws, 2 wins for Flamengo, and 1 win for Fluminense. When Fluminense played at home, there were two draws and one win for Fluminense.
From this result, we can compare it with the first encounter between the teams in 2023, which took place in the final round of the Taça Guanabara and ended in a 2-1 win for Fluminense. That result was the second most likely according to our model, indicating that the match followed the expected trend based on the teams’ offensive and defensive performance from the previous season.
Moreover, we didn’t use data from earlier 2023 Campeonato Carioca matches, which could provide more up-to-date offensive and defensive strength values — and thus a different probability distribution.
With this analysis, we wrap up our series of posts, where we’ve explored some predictive models applied to football and how we can use them to better understand the sport.
Enjoy Reading This Article?
Here are some more articles you might like to read next: