What the Data Says About Relegated Teams
Se quiser ler esse texto em pt-br, clique aqui.
Introduction
In football, most national leagues around the world use a system of relegation and promotion: the teams with the worst performances at the end of the season are replaced by newly promoted teams in the following championship. For the clubs that go down, this change often represents not only failed sporting planning, but also the need to readjust, both financially and competitively, for the next season.
In this post, the goal is to better understand the performance of clubs that are relegated. The study compares these clubs in 3 different ways:
- Clubs: analyze the differences between relegated clubs and the other clubs in the same league, in the same year.
- League: analyze the differences between the relegated clubs of one league and those relegated in other leagues.
- Time: analyze the turnover of clubs that were relegated or promoted in different leagues.
Through this comparison, we seek to better understand how these teams perform in different aspects.
Data
This study used simple match data from the top divisions of Brazil, England, Spain, Germany and France between the 2005 and 2015 seasons.
Quintile Split
To make the comparisons, we split the clubs of each season into 5 groups (quintiles) based on their final league position. Q1 represents the best teams, while Q5 represents the worst. Based on these groups, we carried out the comparisons described below.
Before the results, two notes on the scope of the analysis. In the Brazilian Série A, which relegates four clubs per season, Q5 practically matches the relegation zone. In the European leagues, which relegate fewer clubs, Q5 also includes teams that narrowly escaped the drop. Throughout the text, we treat Q5 as the group of relegated teams, and this approximation should be kept in mind. In addition, the analysis uses only match results and is exploratory: the goal is to describe patterns across leagues and groups of teams, and the explanations discussed for these patterns, such as revenue distribution, are interpretations that were not directly tested in the data.
Results
The first two analyses, points percentage and home advantage, compare the quintiles within each league and across leagues, covering the Clubs and League axes. The turnover analysis covers the Time axis.
Points Percentage
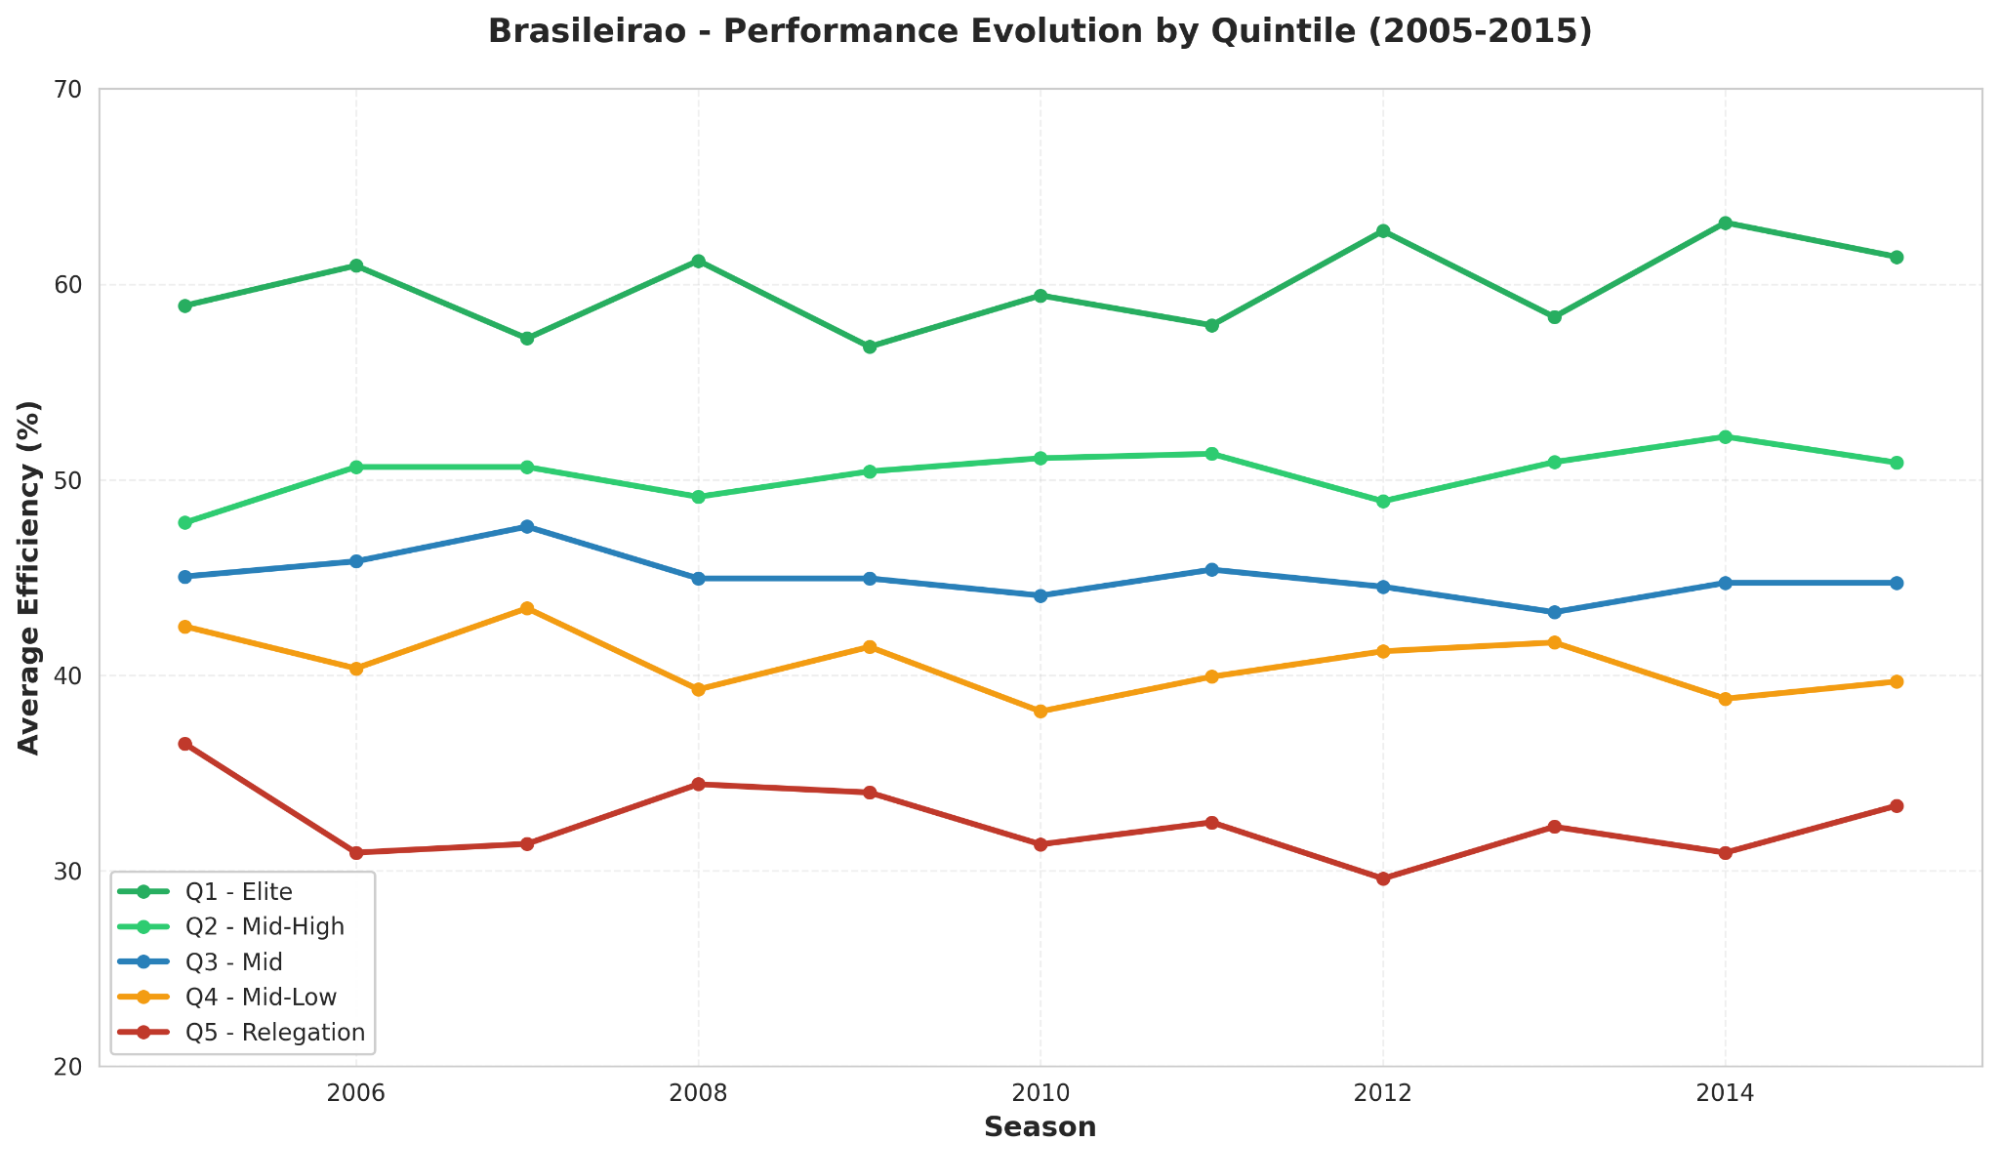
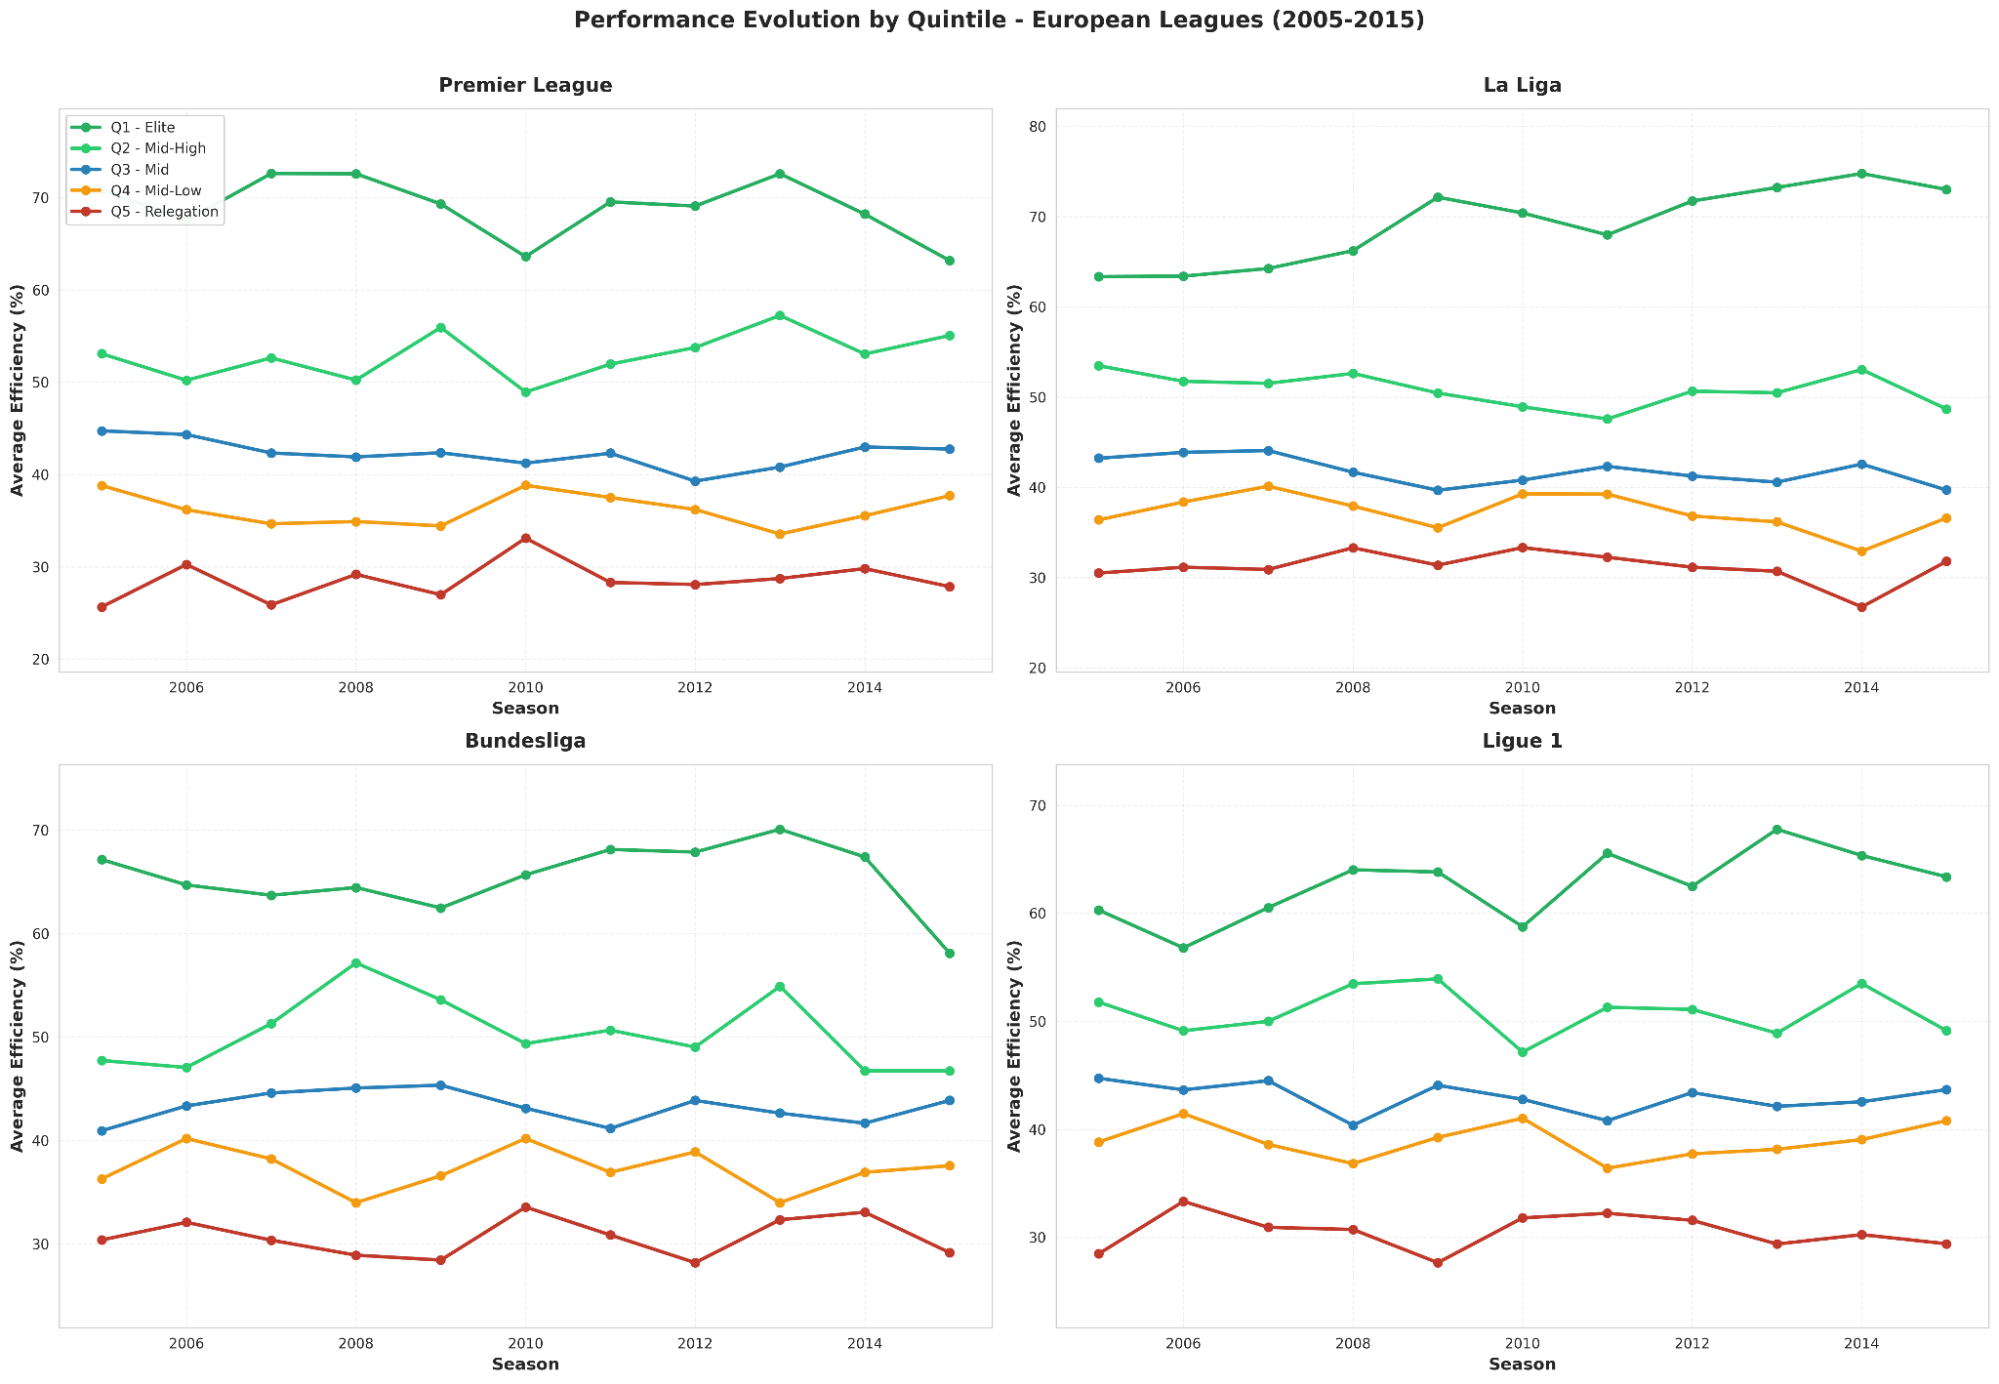
Points percentage (labeled efficiency in the charts) is the share of available points that a team won. The results below (Figures 1 and 2) show that the average points percentage of teams at the bottom of the table is similar regardless of the league or season: on average, Q5 sits between 28% and 33% in every league. At the top, on the other hand, the gap between Q1 and Q2 shows how far the "elite" teams in the European leagues are from the rest. This gap is around 9 percentage points in the Brazilian Série A, compared with somewhere between 12 and 18 in the European leagues.
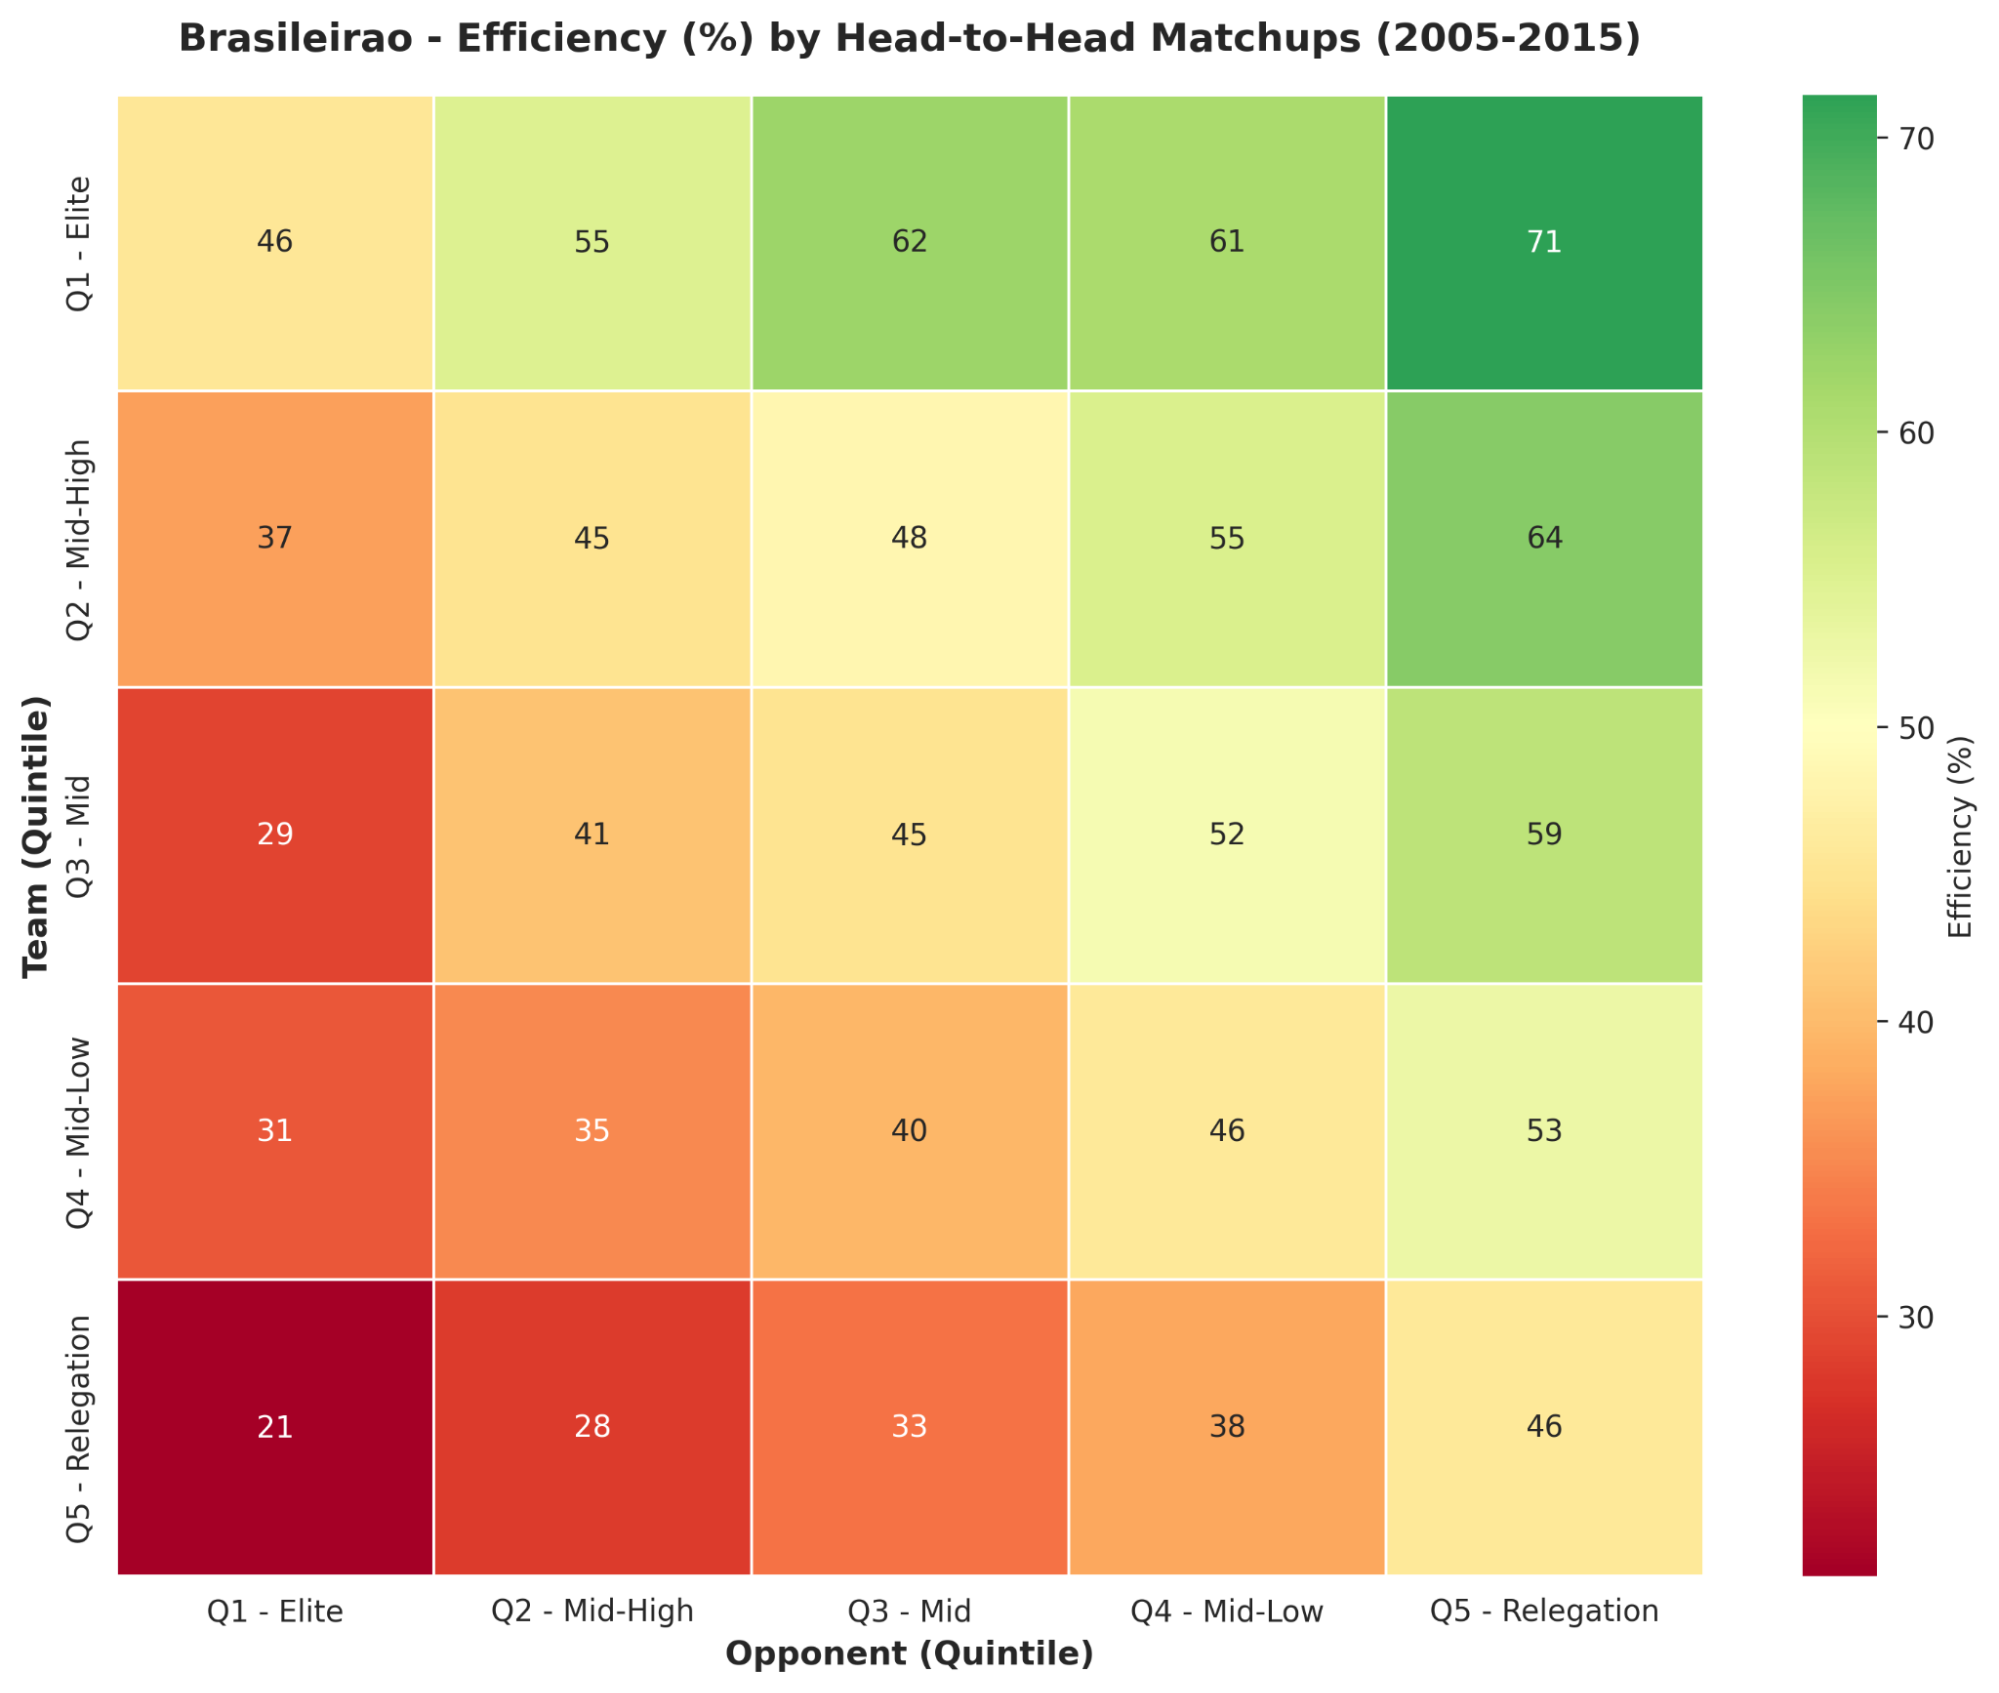
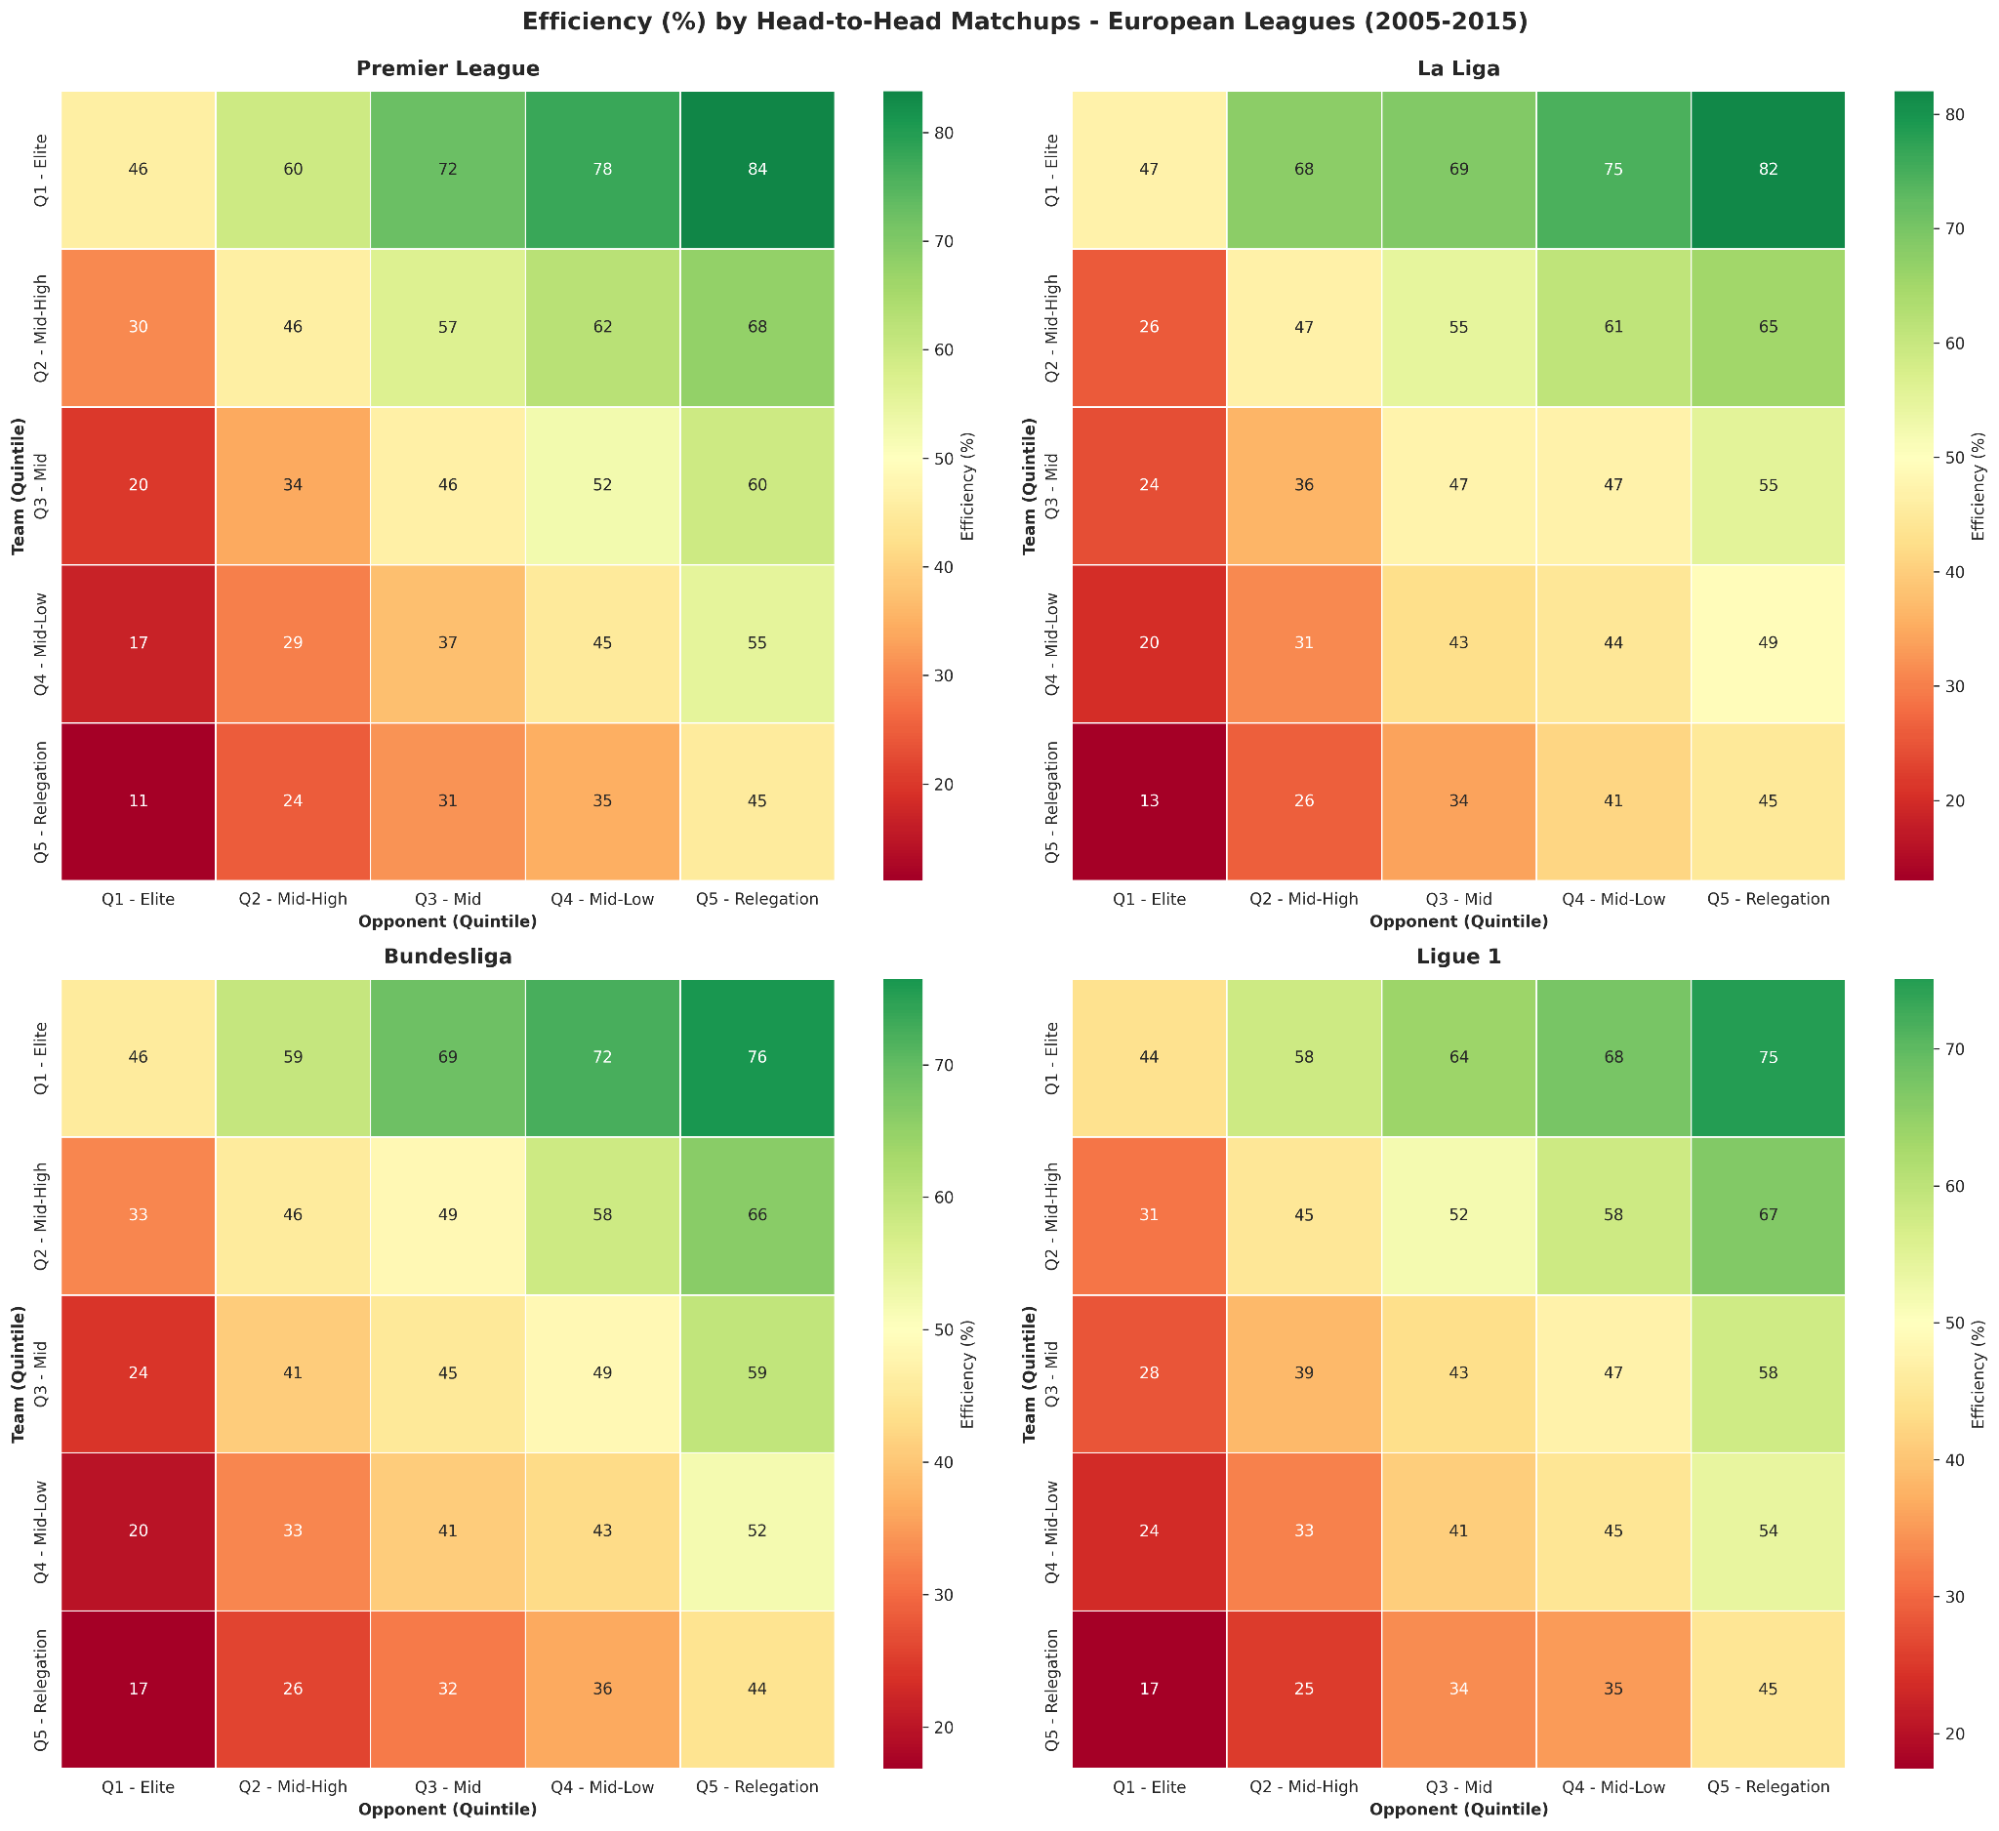
The same picture appears in the head-to-head matrices between quintiles (Figures 3 and 4). The structure is identical in every league: a team's points percentage drops as the opponent belongs to a better quintile. The intensity, however, varies. Against Q1, Q5 teams won 21% of the points in the Brazilian Série A, compared with 11% to 17% in the European leagues; in the opposite direction, Q1 won 71% of the points against Q5 in Brazil and between 75% and 84% in Europe. Matchups between the top and the bottom of the table are therefore more balanced in Brazil.
On the diagonal of the matrices, where teams from the same quintile meet, the points percentage is close to 45% in every league, a little below the 50% one might expect. The difference comes from draws: in balanced matchups, wins and losses cancel out, but each draw hands out only 2 of the 3 points at stake.
Home Advantage
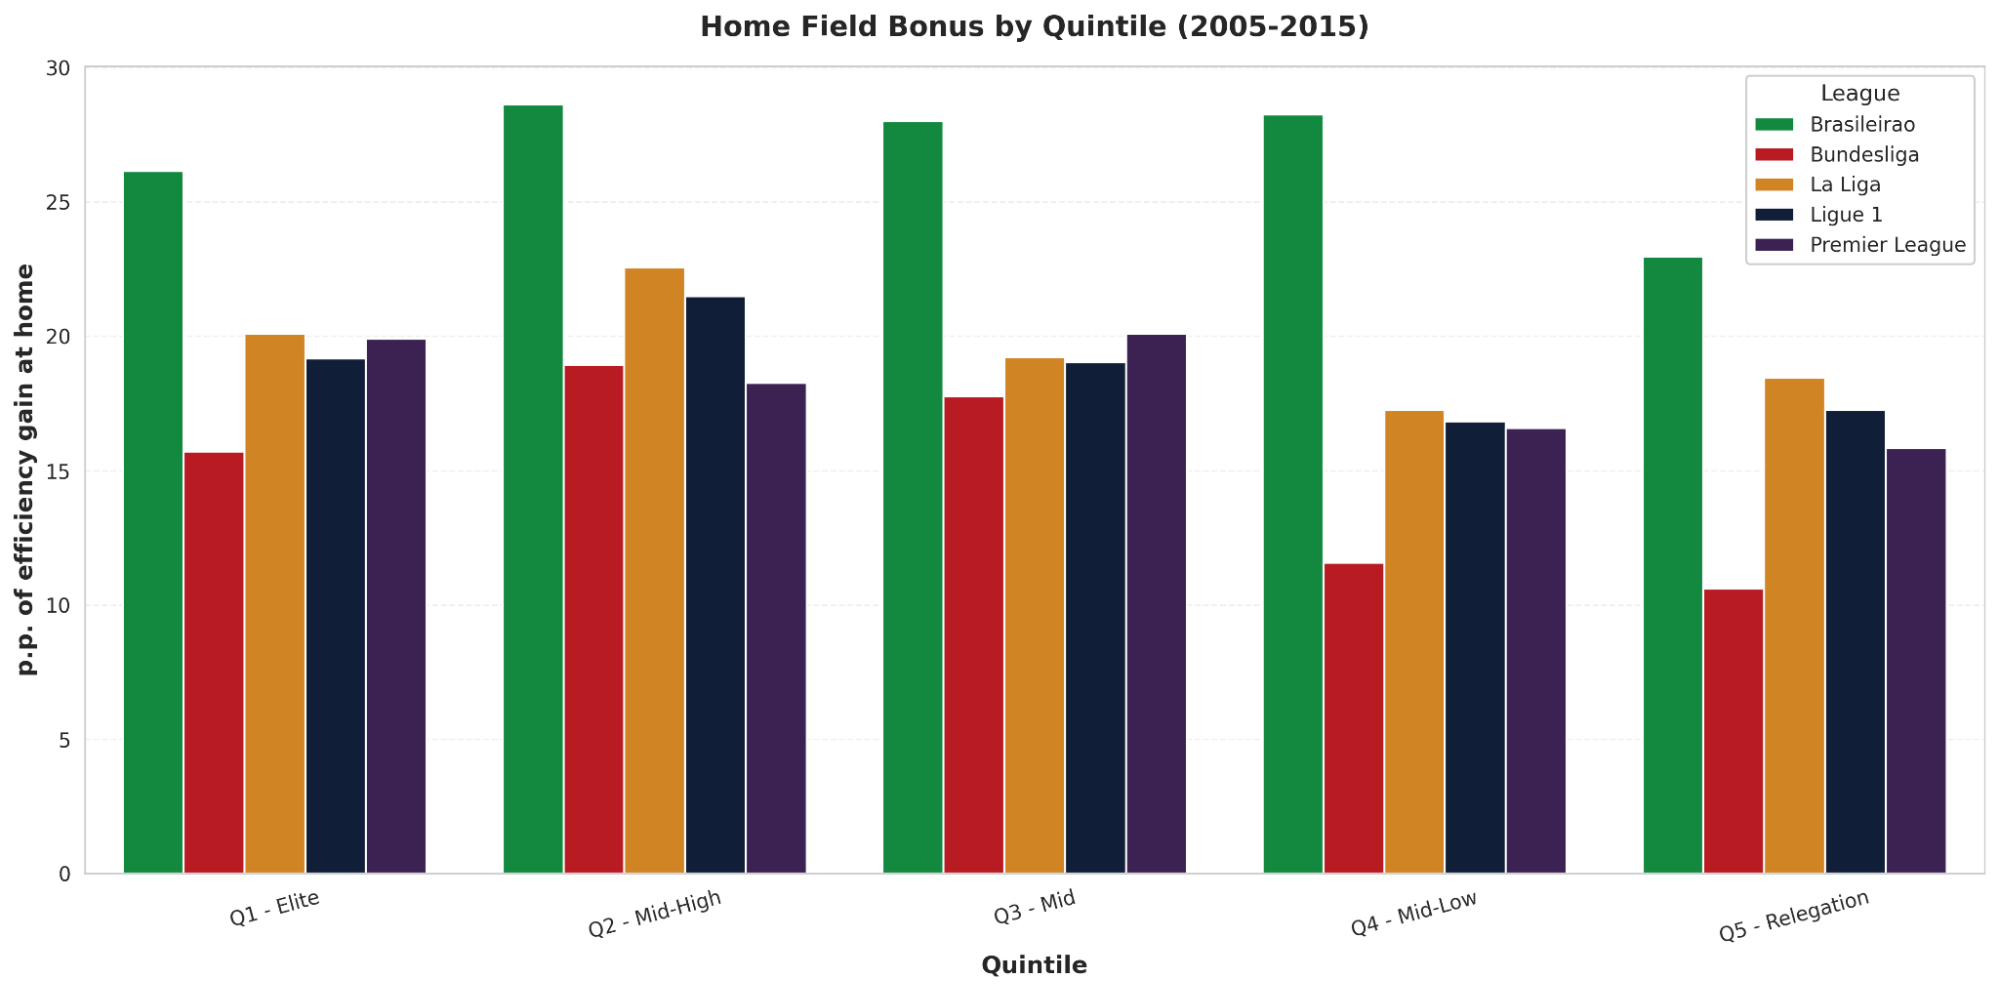
For teams at the bottom of the table (Q4 and Q5), home advantage carries less weight than for the other competitors (Figure 5). In the Brazilian Série A, the Bundesliga and the Premier League, Q5 has the smallest bonus; in La Liga and Ligue 1, Q4 sits slightly below it. Struggling to dominate at home is therefore a characteristic of teams fighting relegation. This pattern is especially significant in the Brazilian Série A, a league where home advantage tends to matter more: the bonus of Brazil's Q5, around 23 percentage points, is practically equal to the largest bonus observed in the European leagues.
Promotion and Relegation Turnover
Finally, the comparison across leagues shows that the Brazilian Série A has greater turnover between divisions than the European championships (Figure 6), which means newly promoted Brazilian teams face significant obstacles to establish themselves. The difficulty shows up after the first year: 71% of promoted teams in Brazil are still in the top flight after one season, compared with around 60% in the Premier League, the Bundesliga and Ligue 1. The drop comes in the following years, and by the third year the Brazilian Série A already has the lowest retention rate among the five leagues (22%).
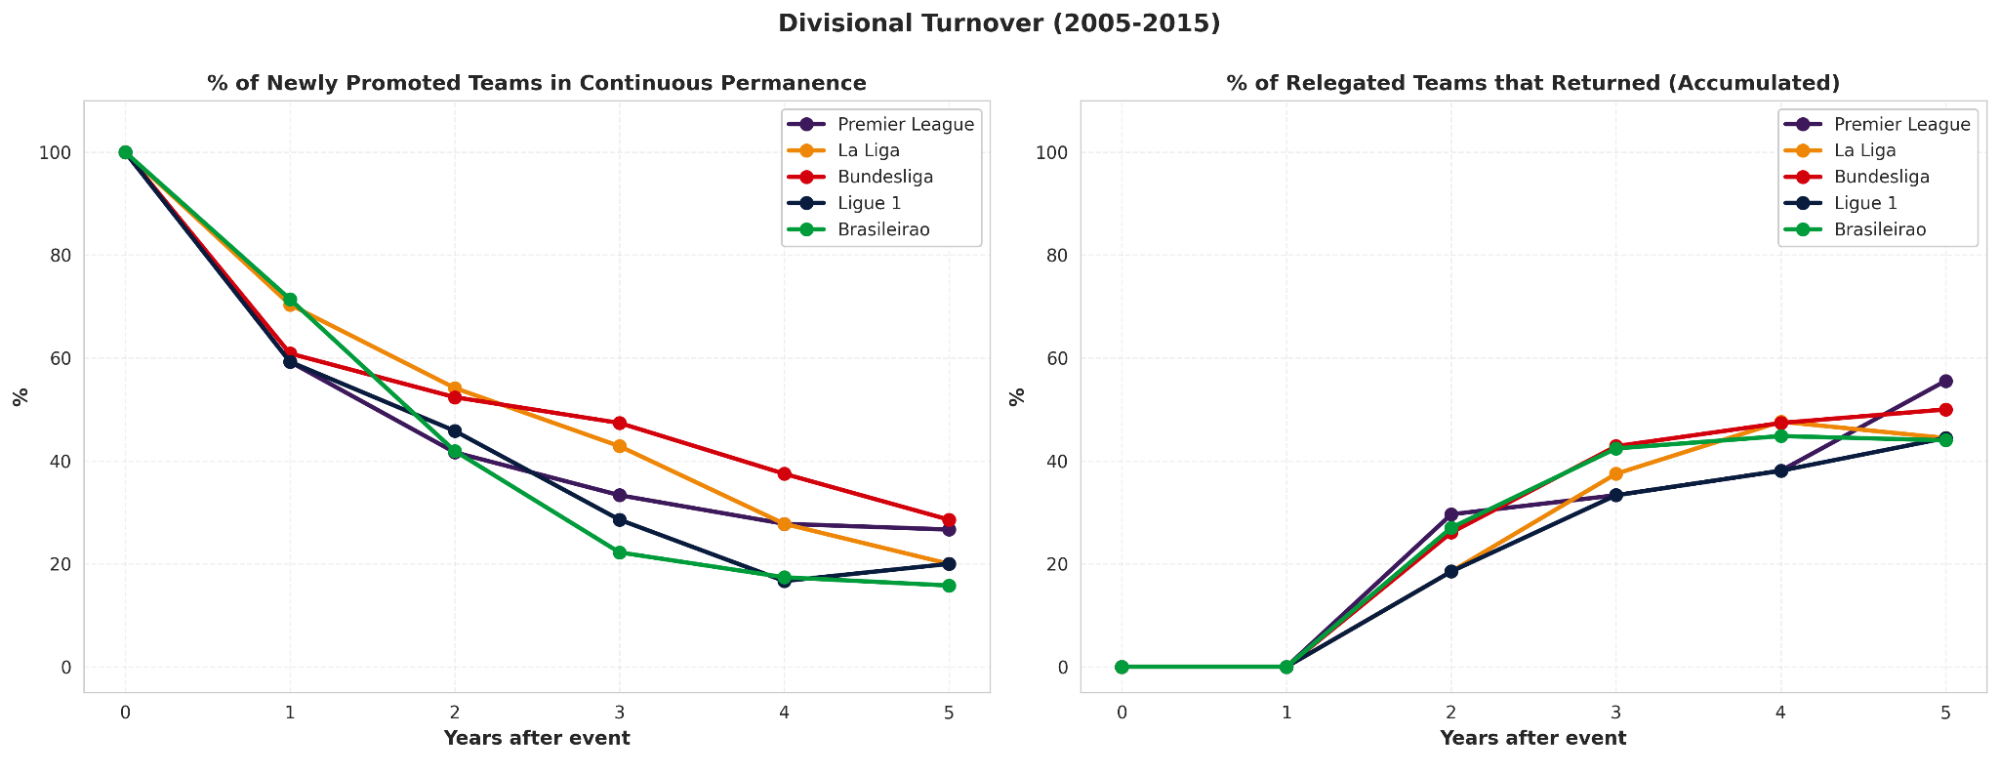
This phenomenon is likely associated with the unequal distribution of revenues (sponsorship, TV rights). Leagues that concentrate resources tend to sustain budget gaps over time. The Premier League, despite its fairer distribution, still illustrates this: promoted teams face a high risk of going straight back down because of the gap between divisions, but if they survive the first years, they gradually catch up with their rivals. The Brazilian Série A shows a different dynamic, in which the notoriously unequal distribution of revenues among clubs holds back newly promoted teams and keeps their risk of relegation high even after they get through the first years.
Going the other way, the right panel of Figure 6 shows that, in every league, between 44% and 56% of relegated teams return to the top division within five years. None of them returns in the first year, since the season after relegation is necessarily played in the lower division.
Conclusion
At the end of this study, we can conclude that relegated teams do face different realities depending on the league. In Brazil, newly promoted teams usually get through their first season, but few manage to stay in the top flight in the following years. In Europe, although newly promoted teams run a greater risk in their first seasons, they are more likely to establish themselves in the top division over the years.
Looking more closely at what happens on the pitch, a defining trait of relegated teams was their difficulty in imposing themselves at home. Once again, this stands out in the Brazilian Série A, where home advantage proves even more relevant than in the other leagues.
For future research, one possible path is to analyze the players and coaches of these teams, looking for trends in the makeup of their squads and coaching staffs.
Enjoy Reading This Article?
Here are some more articles you might like to read next: