The Impact of the Scoreline on Physical Performance
Se quiser ler esse texto em pt-br, clique aqui.
In football, a goal does not change only the scoreline; the effect of this change ripples through the entire match. But to what extent can we observe these tactical reflexes, and to what extent are they noticed physically? It was in pursuit of this answer that we conducted an analysis of tracking data from the 2024/25 J-League season. Of the 380 matches in the season, 343 had goals, and from these, we sought to understand how the context of the match directly influences the physical behavior of athletes on the pitch. The answers we found showed remarkable consistency throughout the entire season.
Data and Metrics Explored
To carry out this investigation, we used the open StatsBomb database for this season, observing time intervals close to the goals scored, focusing on the difference in physical data before and after the change in the scoreline.
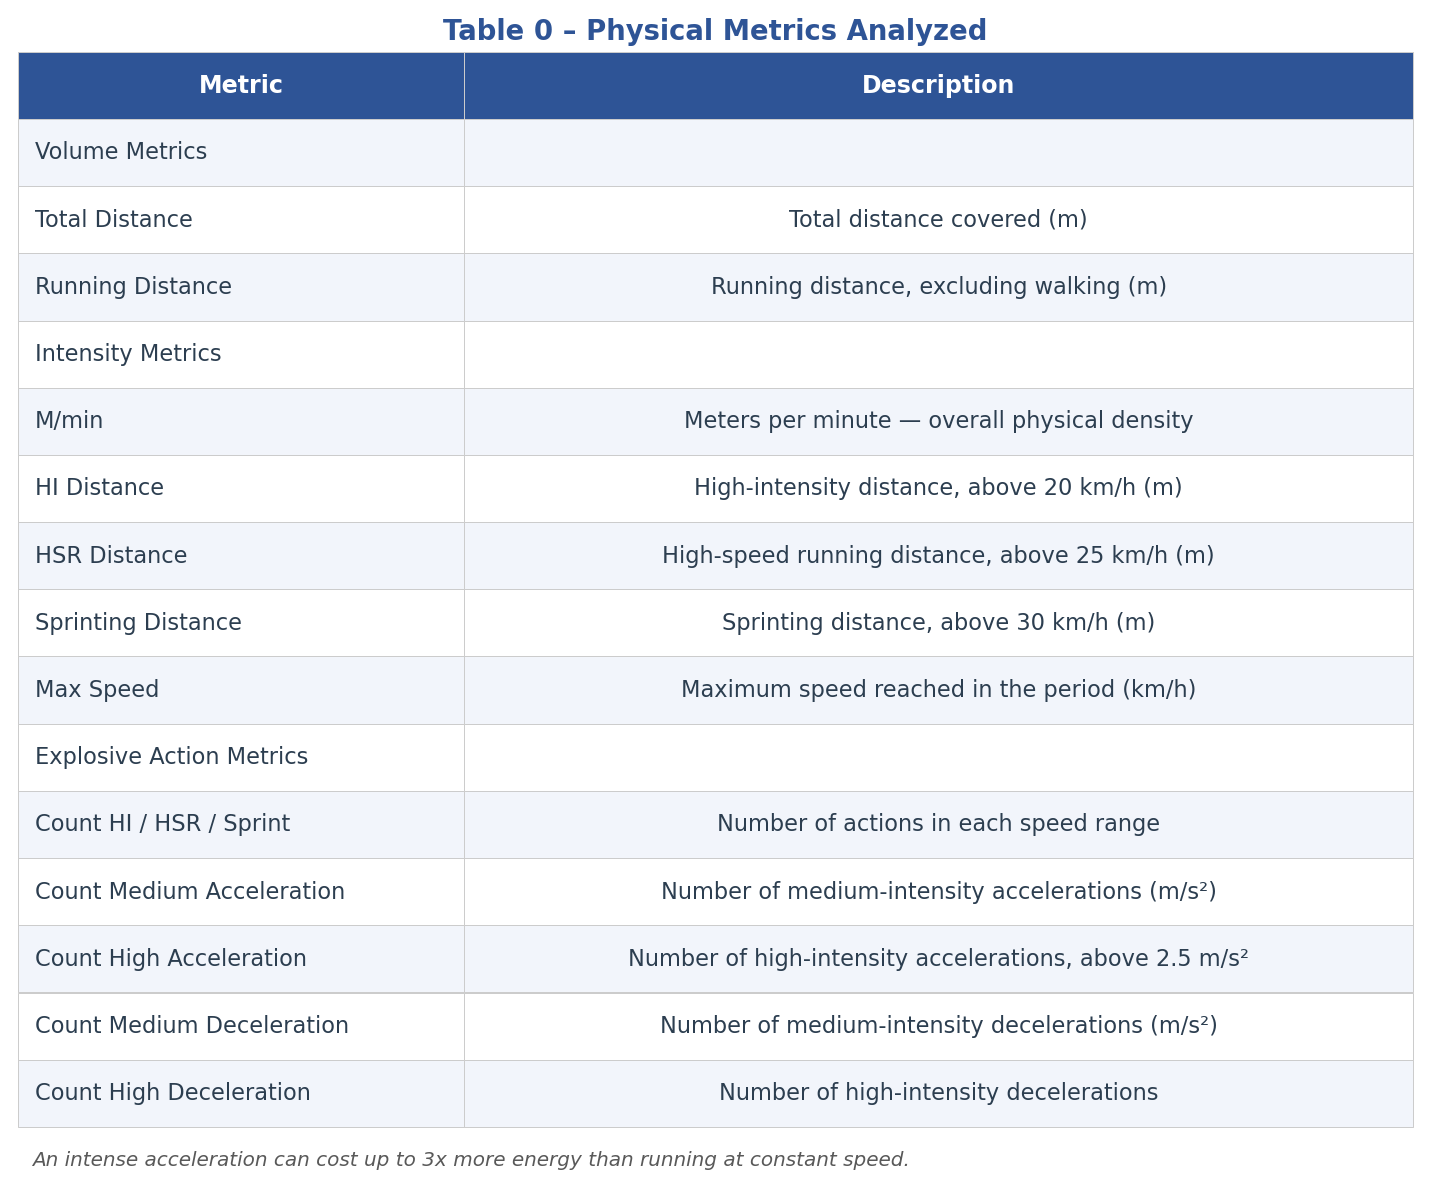
For a comprehensive analysis, we observed all 14 available physical performance indicators, organized into three groups and described in Table 0 below:
The First Goal Phenomenon
As we deepened our analysis, a clear pattern began to emerge: not all goals have the same impact on the match.
The first goal of the match stands out as the main rupture point. Before it, there is a certain state of equilibrium, in which teams organize themselves, manage risks, and maintain a relatively stable rhythm; however, the moment the scoreline is opened, this equilibrium is broken.
The data show a marked increase in all physical metrics immediately after the first goal, as presented in Table 1, with intensity rising abruptly: more displacement, more high-speed actions, and a significant increase in accelerations and decelerations. This behavior suggests that the first goal acts as a trigger that is not only tactical, but also physiological. The match enters a new state, in which sweat is no longer spared by any player.
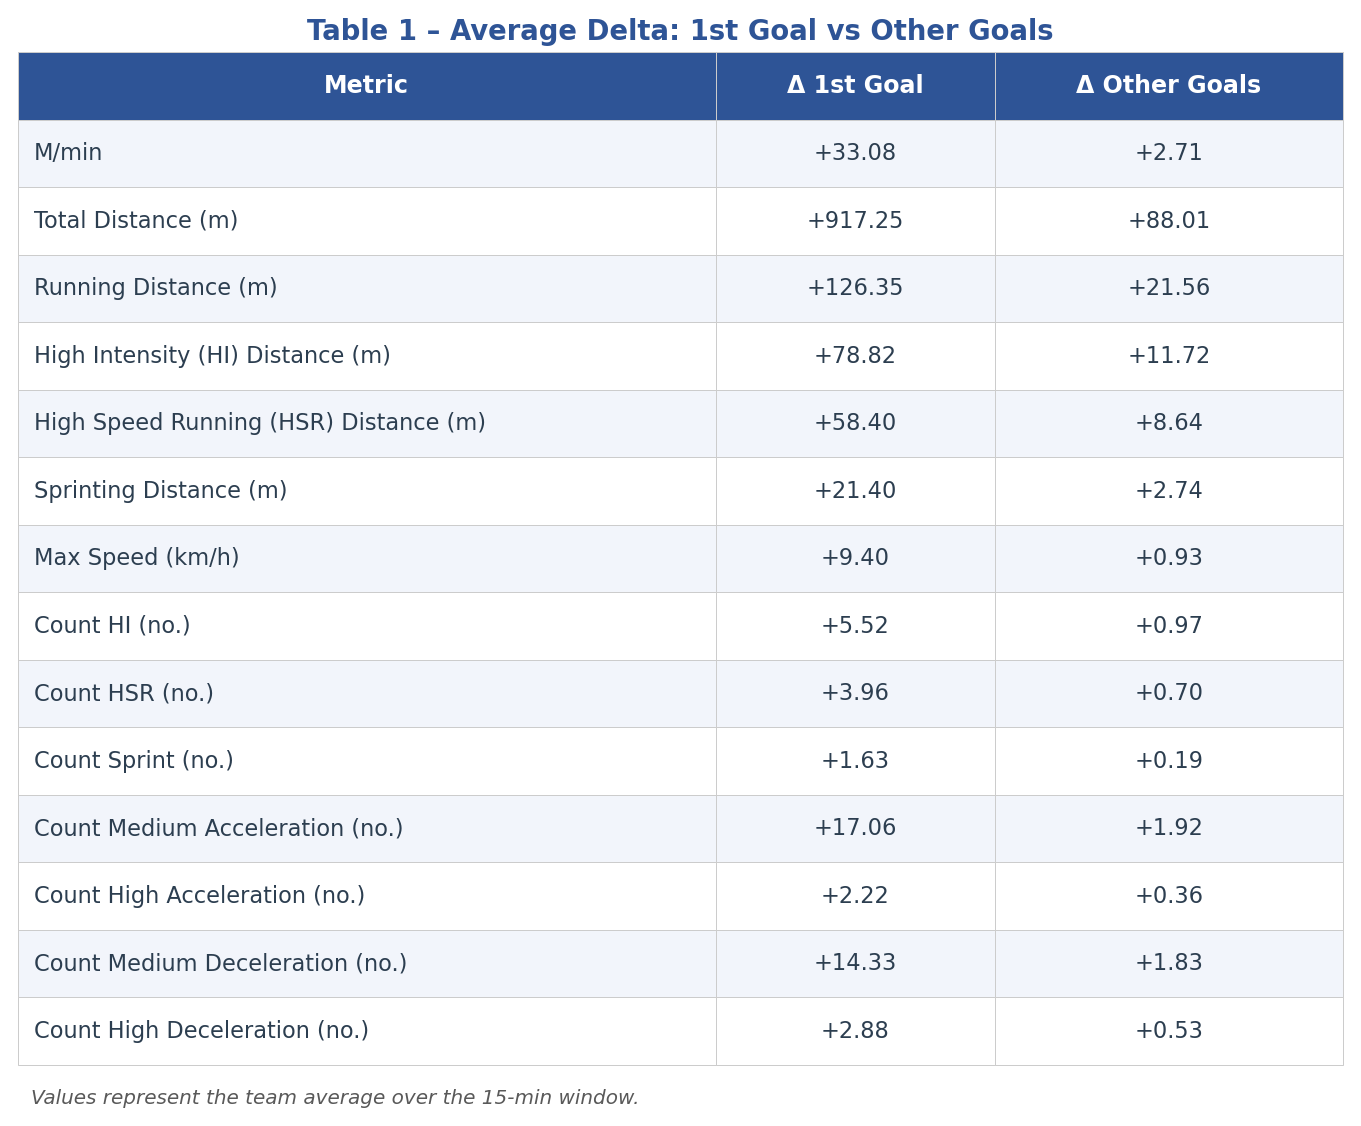
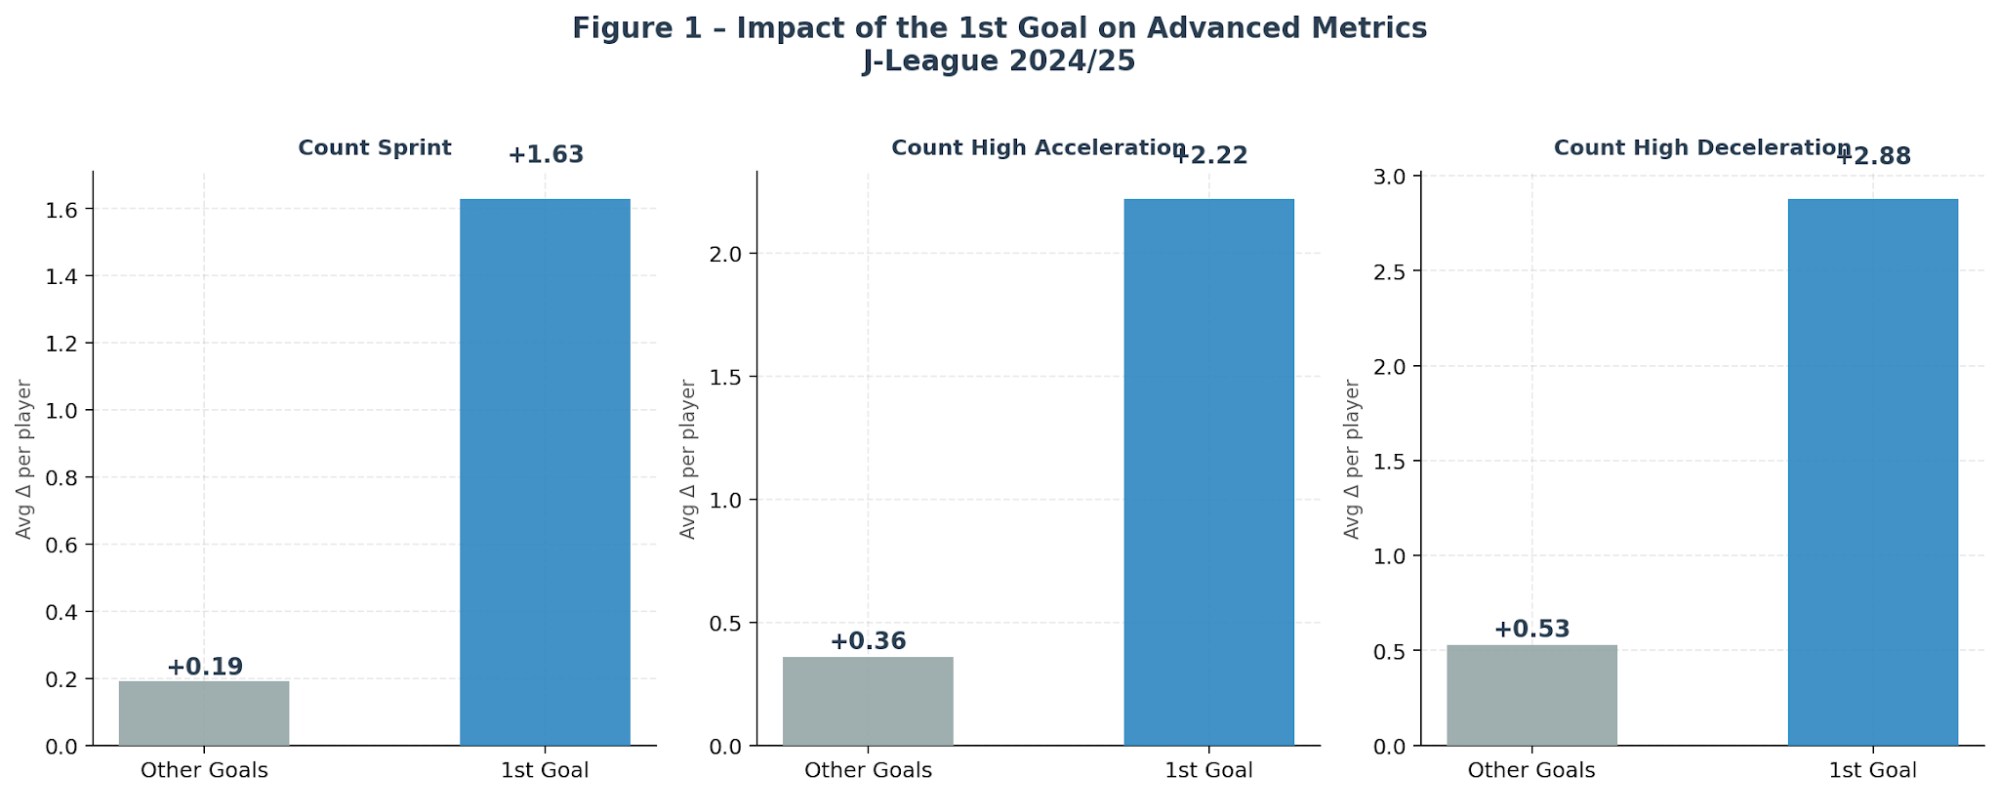
Looking at the table carefully, the most striking finding is the +78.82m increase in HI Distance after the first goal, compared to only +11.72m for subsequent goals. M/min rises by +33 m/min, Total Distance jumps by +917m per team, and explosive actions surge: Count High Acceleration +2.22 and Count High Deceleration +2.88 per player.
This pattern in explosive metrics becomes even clearer when we observe Figure 1, which visually highlights the difference between the first goal and the rest:
Breaking the Match's Inertia
This simultaneous increase in intensity helps explain what actually happens between the four lines after the scoreline opens. Until then, the match tends to follow a more controlled script: both teams prioritize organization, occupation of space, and risk reduction. But starting from the first goal, this scenario changes rapidly, the match loses part of its predictability, moving from a more “studied” phase, and demanding more immediate responses.
An interesting point is that this increase is not exclusive to the trailing team: both teams raise their effort levels in a remarkably similar way, as shown in Figure 2:
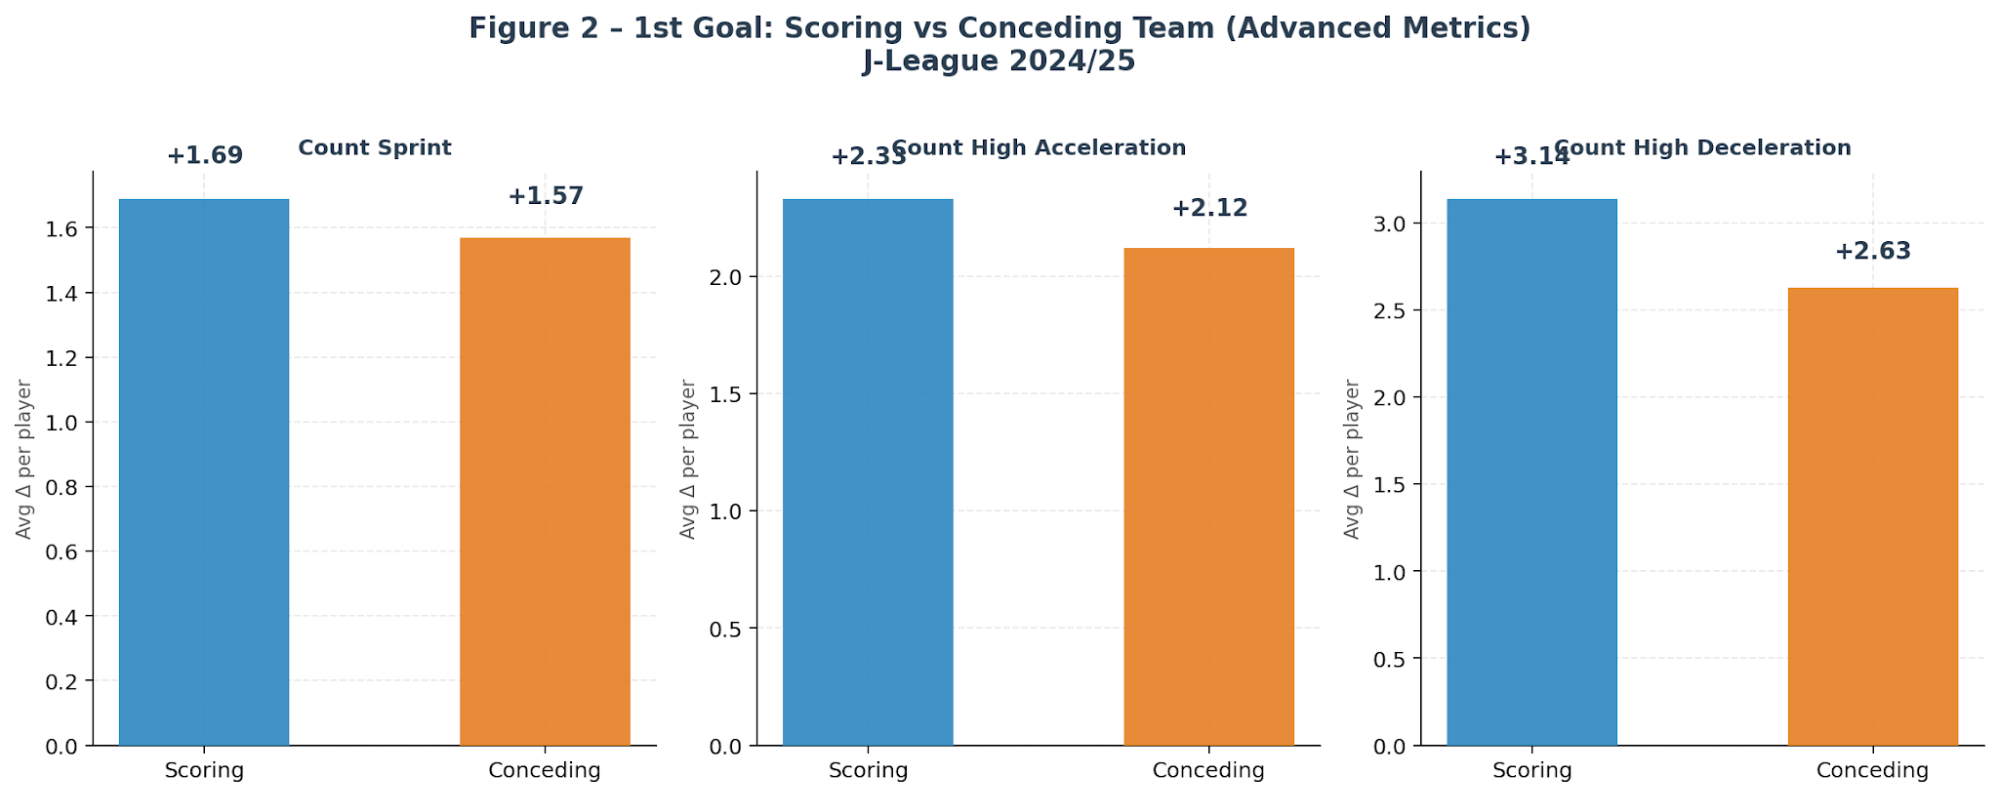
The nearly identical bars for both teams confirm that the change in scoreline alters the global dynamics of the match, and not only the posture of one of the teams. In practice, this translates into more frequent transitions, greater occupation of attacking space, and consequently, an increase in explosive actions. The match not only accelerates, but becomes more demanding across multiple physical dimensions. Table 2 details this bilateral behavior across all 14 metrics:
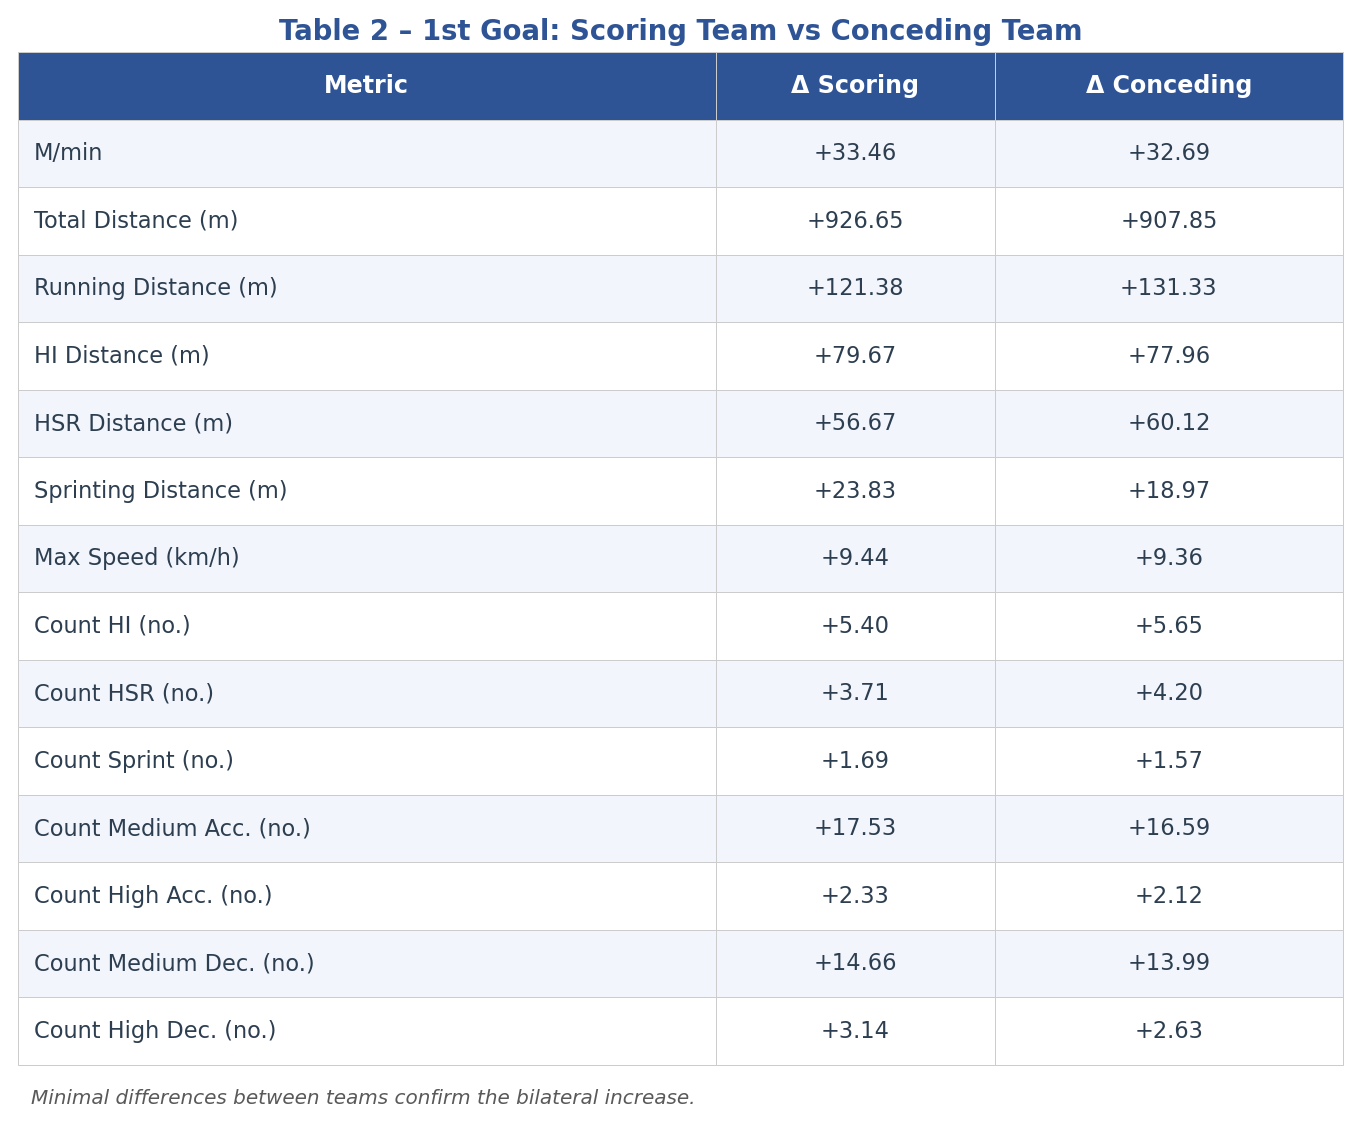
This behavior reinforces the idea that the first goal is not just an isolated event, but a context divider that redefines the level of intensity required in the match.
Not Every Goal Sustains the Same Rhythm
If the first goal acts as this intensity trigger, the subsequent goals show that this effect does not persist in the same way throughout the match. Figure 3 illustrates this dynamic very clearly:
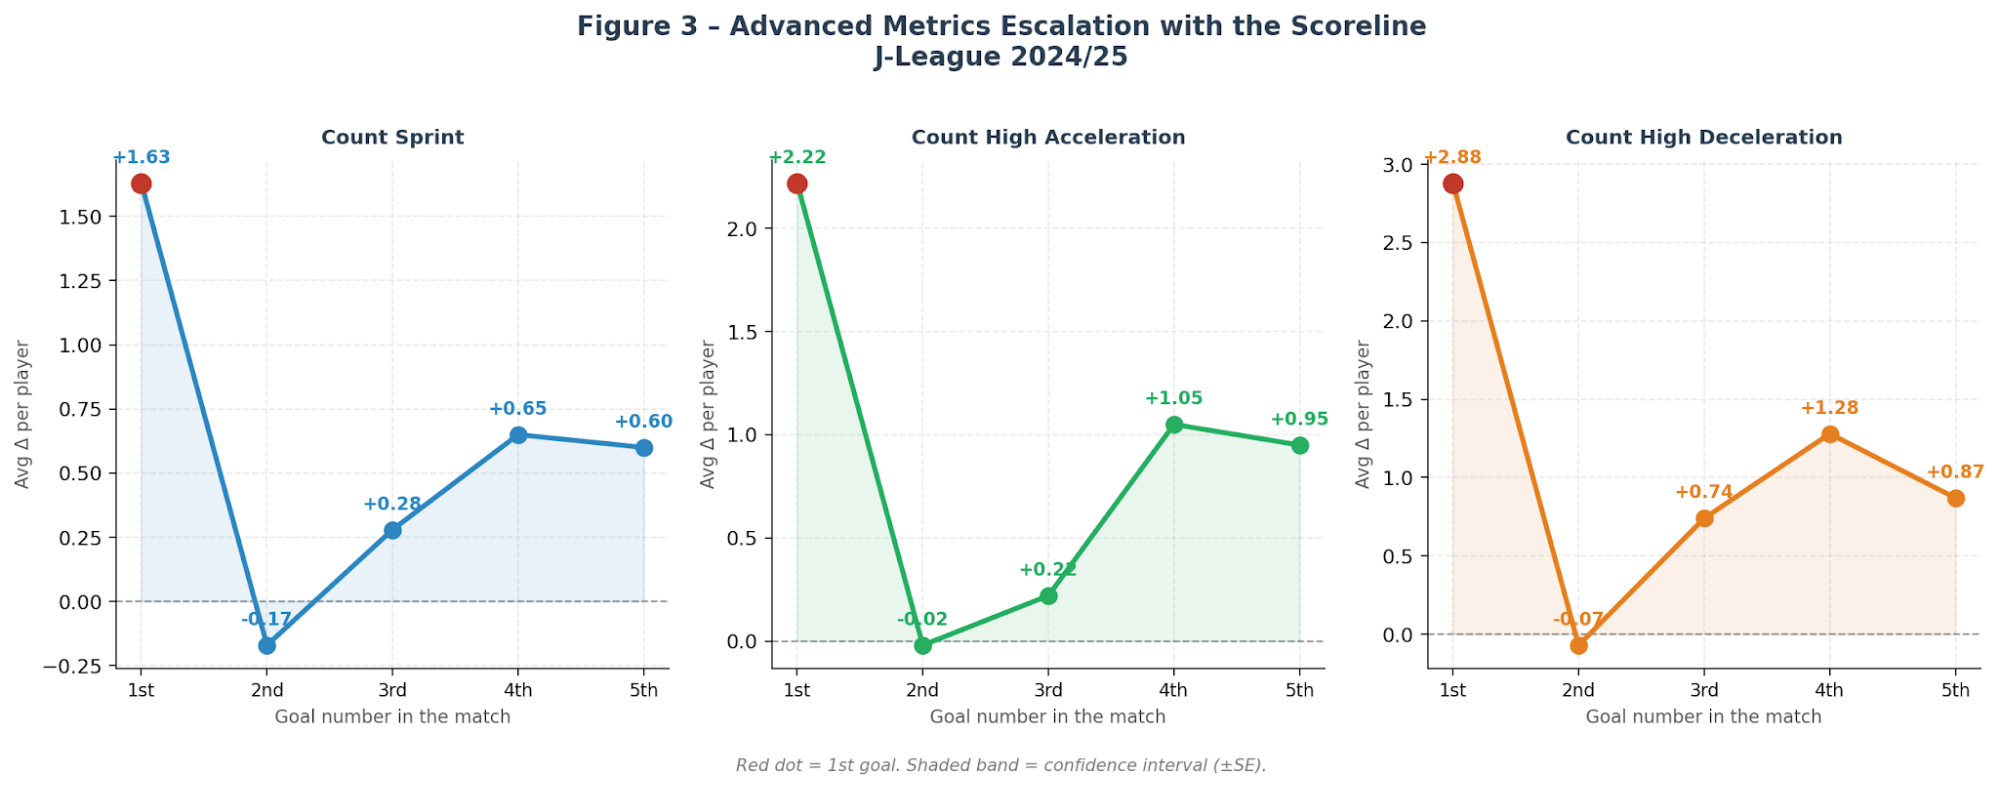
Looking at the goal sequence, we notice that the second goal exhibits a much more moderate behavior; in some cases, intensity metrics remain close to zero or even show slight decreases, especially in high-speed actions and sprints. This pattern suggests that, after the initial impact, teams are able to reorganize themselves within a new state of equilibrium.
From the third goal onward, metrics begin to rise gradually again, especially in contexts where the match becomes more open. The complete numbers of this evolution are organized in Table 3:
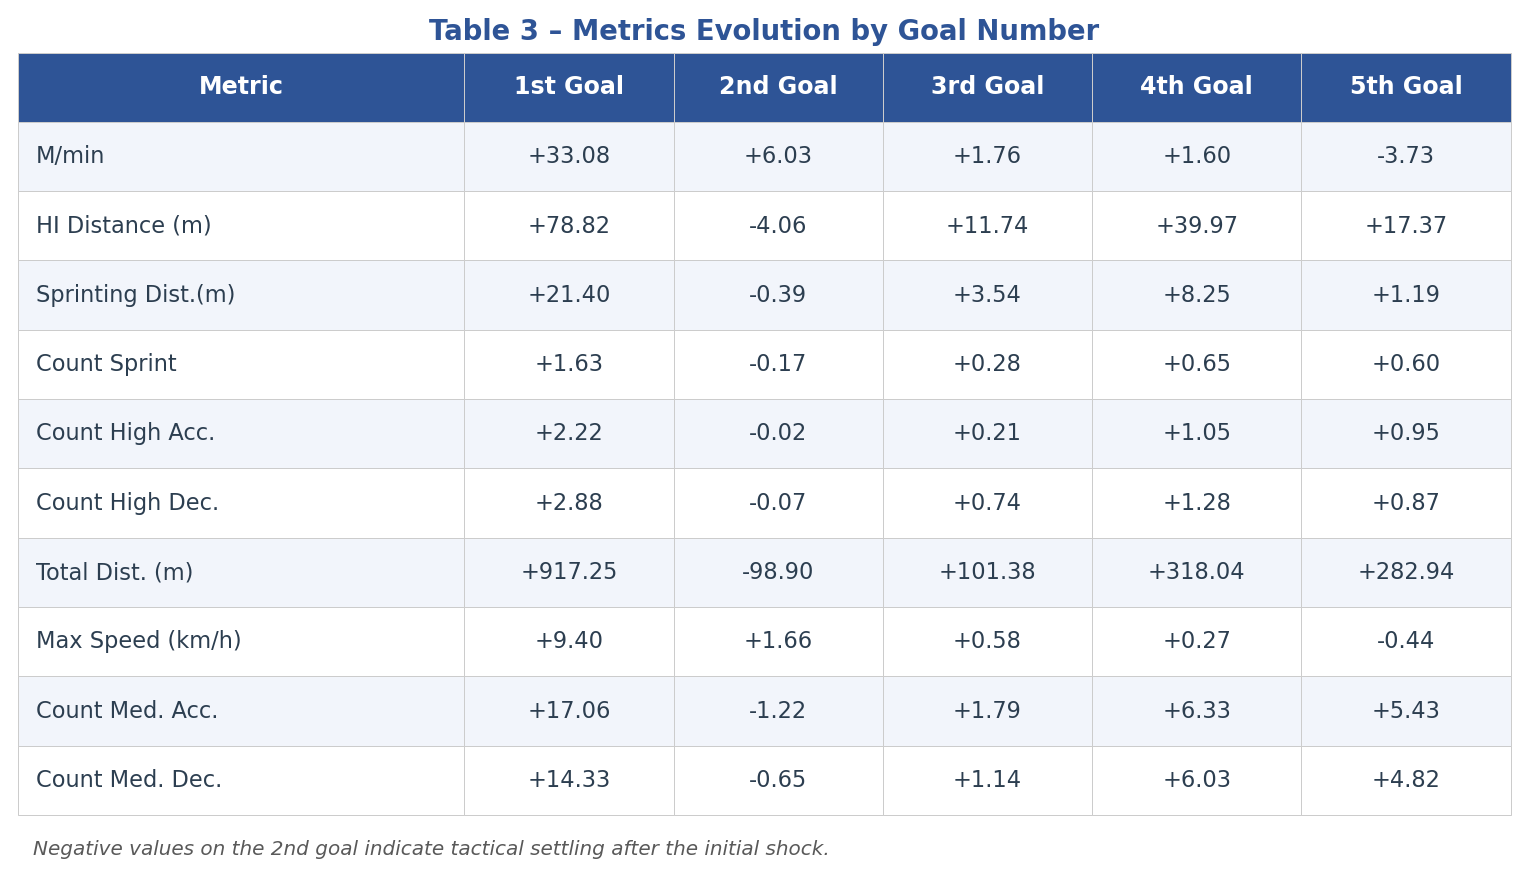
In other words, the behavior across goals seems to follow a clear dynamic: an initial moment of rupture, followed by a stabilization phase, and finally a new rise in intensity in more extreme scoreline scenarios.
The Role of Time: When Fatigue Limits the Response
Another important factor in understanding these variations is the moment of the match in which the goal occurs.
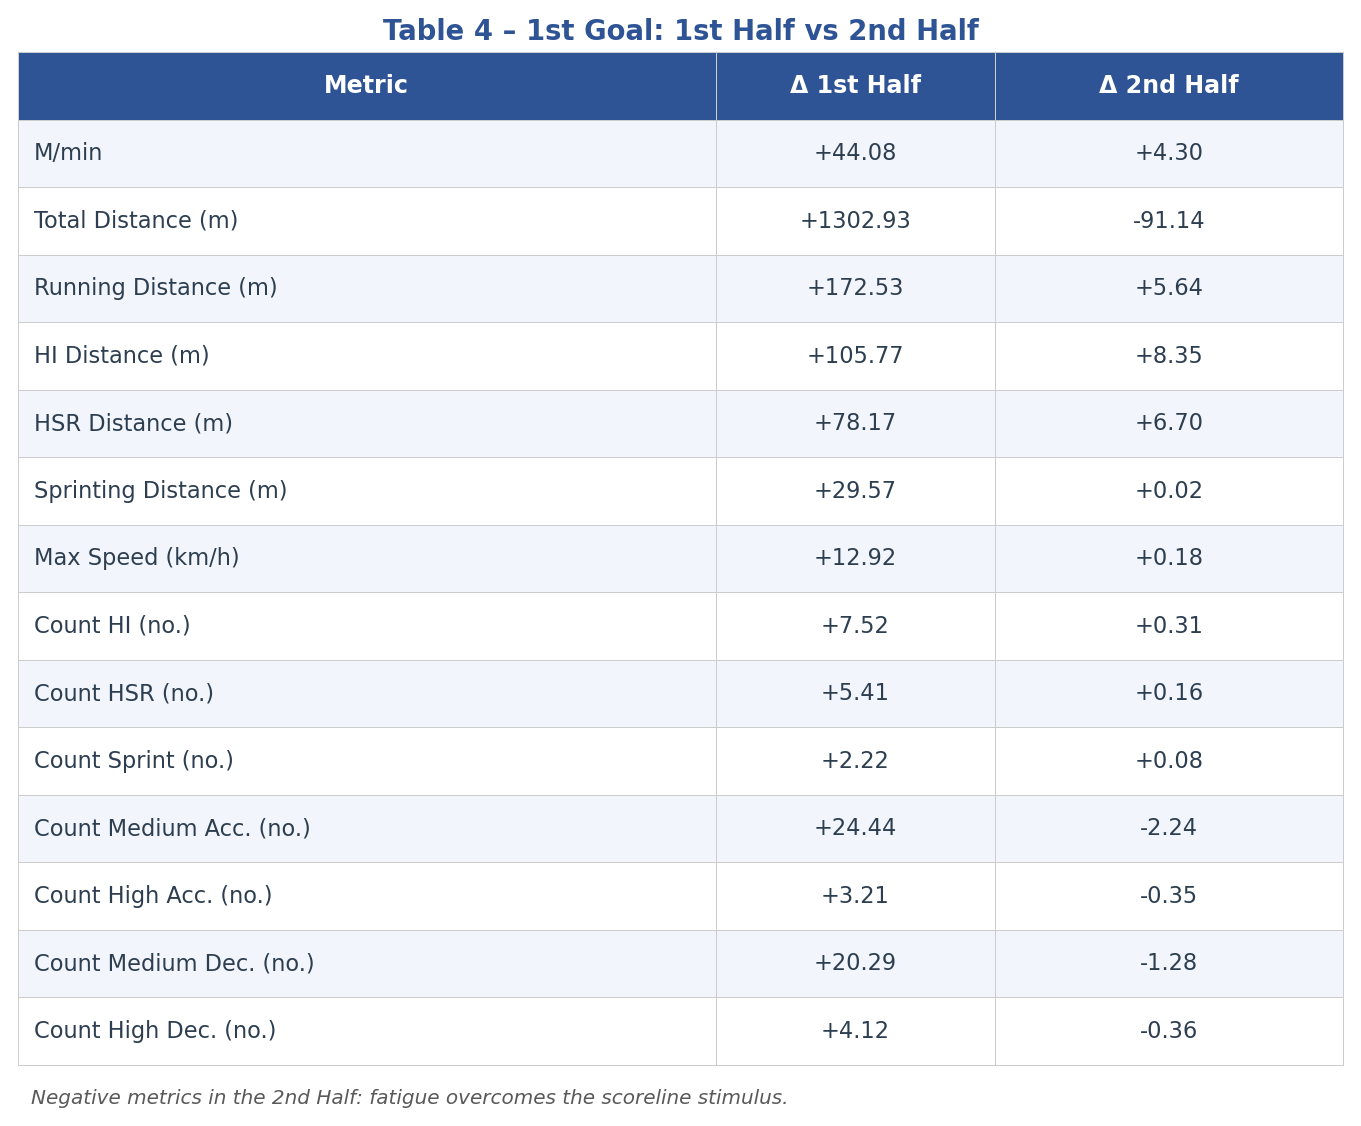
When the first goal occurs in the first half, the physical response is much more intense. Players still have greater energy availability, which allows them to sustain relevant increases in speed, distance covered, and explosive actions. On the other hand, when the same event occurs in the second half, behavior changes significantly: even with the tactical need to react to the scoreline, the physical response becomes more limited. In some cases, important metrics begin to grow very little, or even decrease, indicating that fatigue starts to be the predominant factor.
This shows that there is a clear limit to the players' response capacity. The match may demand more intensity, but the body cannot always meet this demand, especially in the final minutes. The data in Table 4 make this contrast evident:
From Data to Decision
The patterns observed throughout this analysis carry direct implications for the practical context of football.
Load management, for instance, must consider that a goal, especially early in the match, does not represent only a change in the scoreline but also a relevant increase in the physical demand of the game. This increase does not occur only in volume, but mainly in intensity and in the frequency of explosive actions.
Furthermore, metrics such as sprints, accelerations, and decelerations prove particularly useful for in-match decision-making. Reductions in these indicators may signal moments when an athlete can no longer sustain the level of demand imposed by the match, indicating possible substitution needs.
In the training context, these results reinforce the importance of simulating real game scenarios. Reproducing only the average effort volume is not enough — it is necessary to expose athletes to situations that provoke abrupt increases in intensity, such as those observed after scoreline changes.
Finally, there is a direct implication for injury prevention. The combination of high intensity and accumulated fatigue, especially in the final minutes, creates an environment prone to muscle overload. Monitoring this kind of behavior can be decisive for more assertive interventions.
Numbers Don't Tell the Whole Story
In the end, the main insight of this analysis lies not only in the values observed, but in how they should be interpreted: numbers alone do not explain the complete story of the match. We analyzed only numerical data extracted from events captured during matches, which may carry greater meaning when analyzed within context, but we did not watch all matches in their entirety.
These data gain meaning when analyzed within context, and the scoreline emerges as one of the main factors shaping behavior throughout the match. More than that, the scoreline acts as an active element in match dynamics, directly influencing the level of intensity required from athletes.
Understanding this relationship makes it possible to move from a descriptive analysis to a more strategic approach, where data help not only to explain the match, but also to anticipate its developments.
Enjoy Reading This Article?
Here are some more articles you might like to read next: