Does the Playing Style of Brazilian Teams Leave a Signature in Their Match Data?
Se quiser ler esse texto em pt-br, clique aqui.
Every fan can "feel" that teams play differently: one team relies on possession and short circulation, another leans on long balls and aerial play, and a third focuses on transition speed. But is that feeling real — recoverable from match data — or just a narrative built after the fact?
That was the question behind the first slice of our research on tactical identity in the 2026 Brazilian Série A: can you tell which team it is just by looking at the numbers from a match — no scoreline, no crest, no players on the pitch — purely from how it played?
The Data
We used event data from 260 matches across matchdays 1 to 26 of the 2026 Brazilian Série A — almost 70% of the season. Each match generates two observations, one per team, for a total of 520 "team-match" observations across the league's 20 clubs. Each event (pass, shot, duel, foul, etc.) carries the action type, the outcome, the team, the player, the match minute, and, when available, the start and end coordinates on the pitch.
The Variables: How to Summarize "Style" in Numbers
We selected 18 variables that describe how a team executes its actions, not how much it does — prioritizing ratios and spatial measures over raw counts, so as not to confuse style with volume of play. Examples: pass accuracy, forward-pass rate, strong progression rate, average pass length, cross rate, entries into the final third and the box, central circulation, lateral pass dispersion, and share of aerial duels.
Each team's performance in each match thus becomes a vector of 18 numbers — a fingerprint of that game.
The Method: Recognizing a Team Purely by Its Style
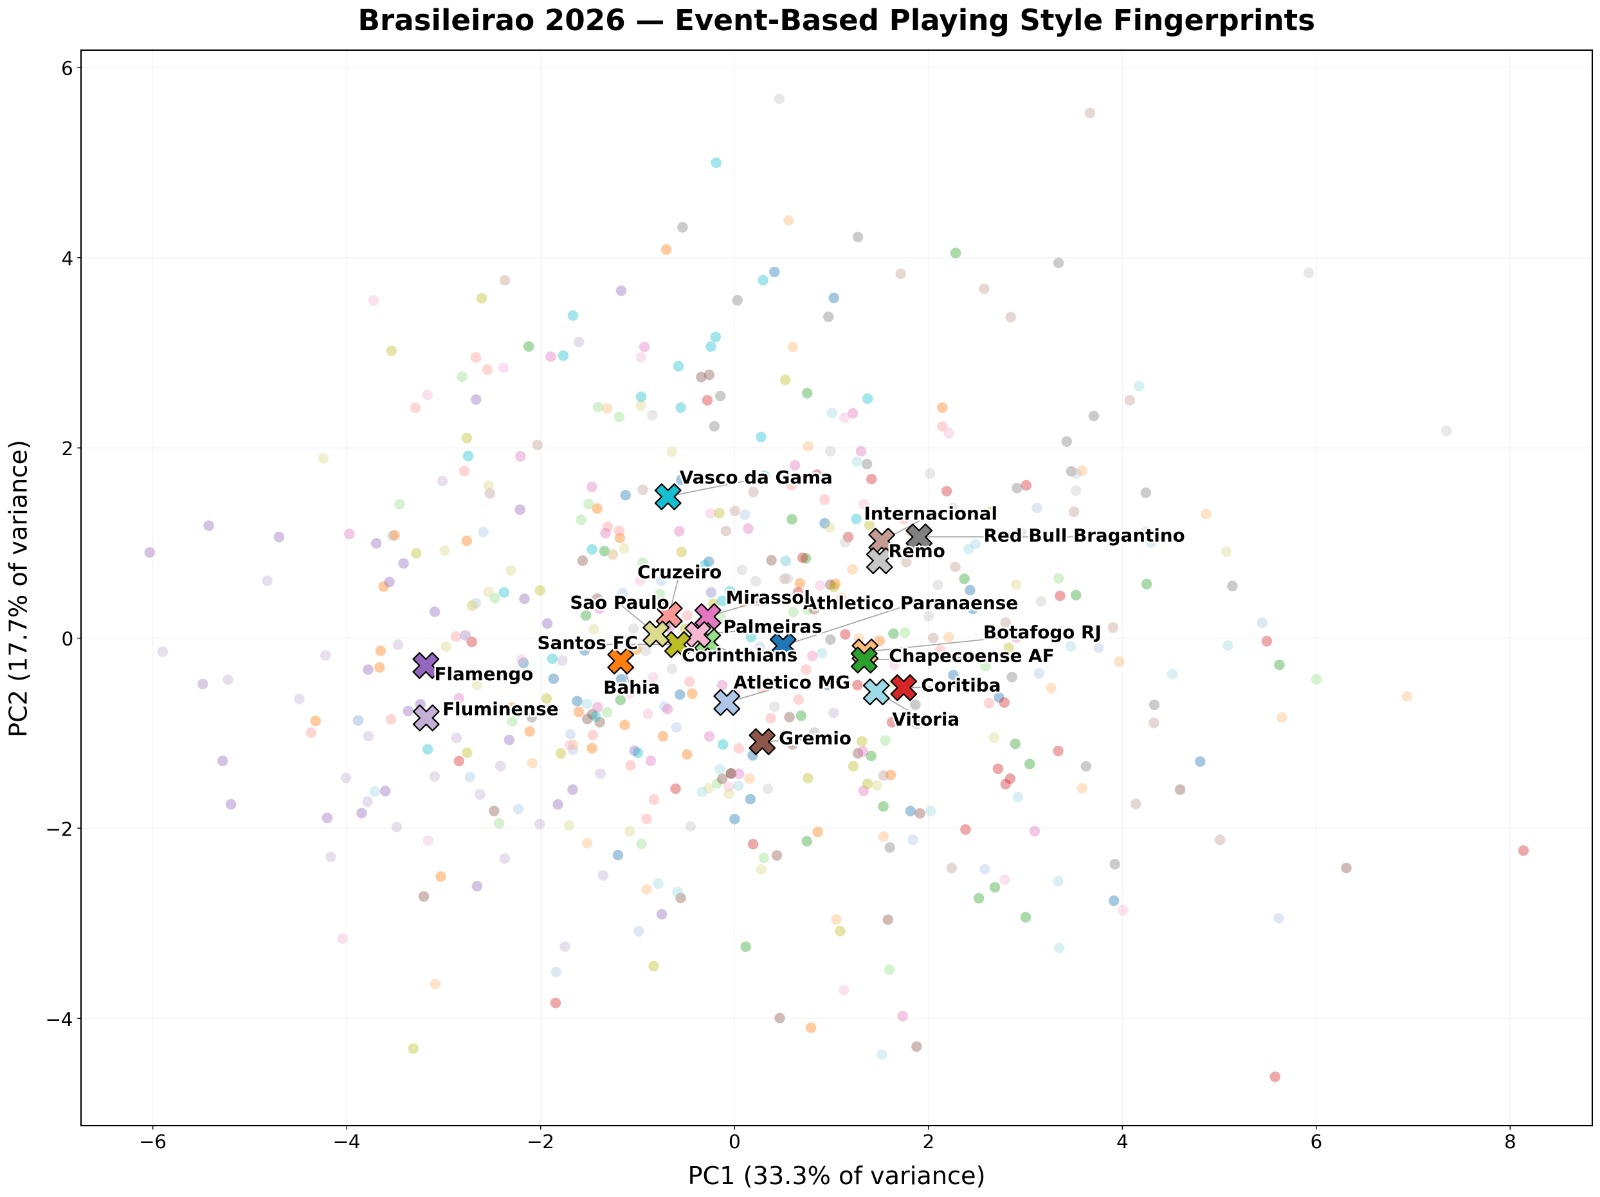
We standardized the 18 variables (so they would be on the same scale) and defined each club's identity as the centroid — the average — of all its match signatures. The distance between two styles is the Euclidean distance between these centroids.
The core test is straightforward: for each performance, we remove it from the set, recalculate the centroids without it, and ask "which centroid is this anonymous performance closest to?". A hit is when the closest centroid belongs to the team itself. We repeat this for all 520 observations (leave-one-match-out) and also check whether the correct team appears among the three closest centroids (Top-3).
To confirm that accuracy above chance is not a coincidence, we shuffled team labels 2,000 times and repeated the process, generating a reference distribution of what would happen with no identity at all to recognize.
One note before the results: this is a straightforward idea of how to recognize teams by the way they play, not a proposal for a definitive method. A distance to centroids, a slice of 26 of the 38 matchdays and a lean set of variables are choices that favor clarity of explanation over technical sophistication. The goal here is exploratory and educational: to show that the question can be investigated with data and to open the way for more elaborate versions of the analysis in the future — not to settle the matter.
The Result: Yes, There Is a Signature
The method correctly identifies the team in 21.15% of the 520 performances — against a random baseline of 5% (1 in 20 teams), about 4.2 times what chance would predict. Considering the three most likely teams (Top-3), accuracy rises to 43.46%.
The permutation test reinforces the result: across the 2,000 simulations with shuffled labels, average accuracy was 5.21%, and none came anywhere close to the observed 21.15% (the highest was 8.85%). In a scenario with no identity at all to recognize, a result like the one we observed would be extremely rare (p = 0.0005, the lowest value attainable with 2,000 permutations).
That answers the question in the title: yes, playing style leaves a recoverable signature in the data. A team's identity is not just a subjective impression held by fans or analysts — it is a statistically detectable pattern.
But the aggregate accuracy hides a huge difference between clubs. Some teams have a far more "signed" style than others — the five most and the five least recognizable teams in the league for this slice of the season are shown in Table 1:
| Team | Top-1 | Top-3 | Average rank |
|---|---|---|---|
| Fluminense | 64.29% | 82.14% | 3.04 |
| Vasco da Gama | 48.00% | 60.00% | 4.48 |
| Grêmio | 42.31% | 57.69% | 4.54 |
| Flamengo | 38.46% | 76.92% | 3.27 |
| São Paulo | 34.62% | 53.85% | 6.46 |
| ⋯ | |||
| Botafogo RJ | 8.00% | 36.00% | 6.80 |
| Cruzeiro | 7.69% | 19.23% | 6.50 |
| Vitória | 7.41% | 37.04% | 6.59 |
| Palmeiras | 3.70% | 22.22% | 7.59 |
| Corinthians | 0.00% | 19.23% | 6.54 |
Table 1: Teams with the highest and lowest recognizability.
Fluminense stands out as the league's most recognizable team: nearly two-thirds of its performances are correctly identified from the match numbers alone. At the other extreme, Corinthians was not correctly identified in any of the 26 performances analyzed — not because it plays badly, but because its pattern overlaps with other clubs' in the league's "style space".
Conclusion: Recognizable Does Not Mean Better
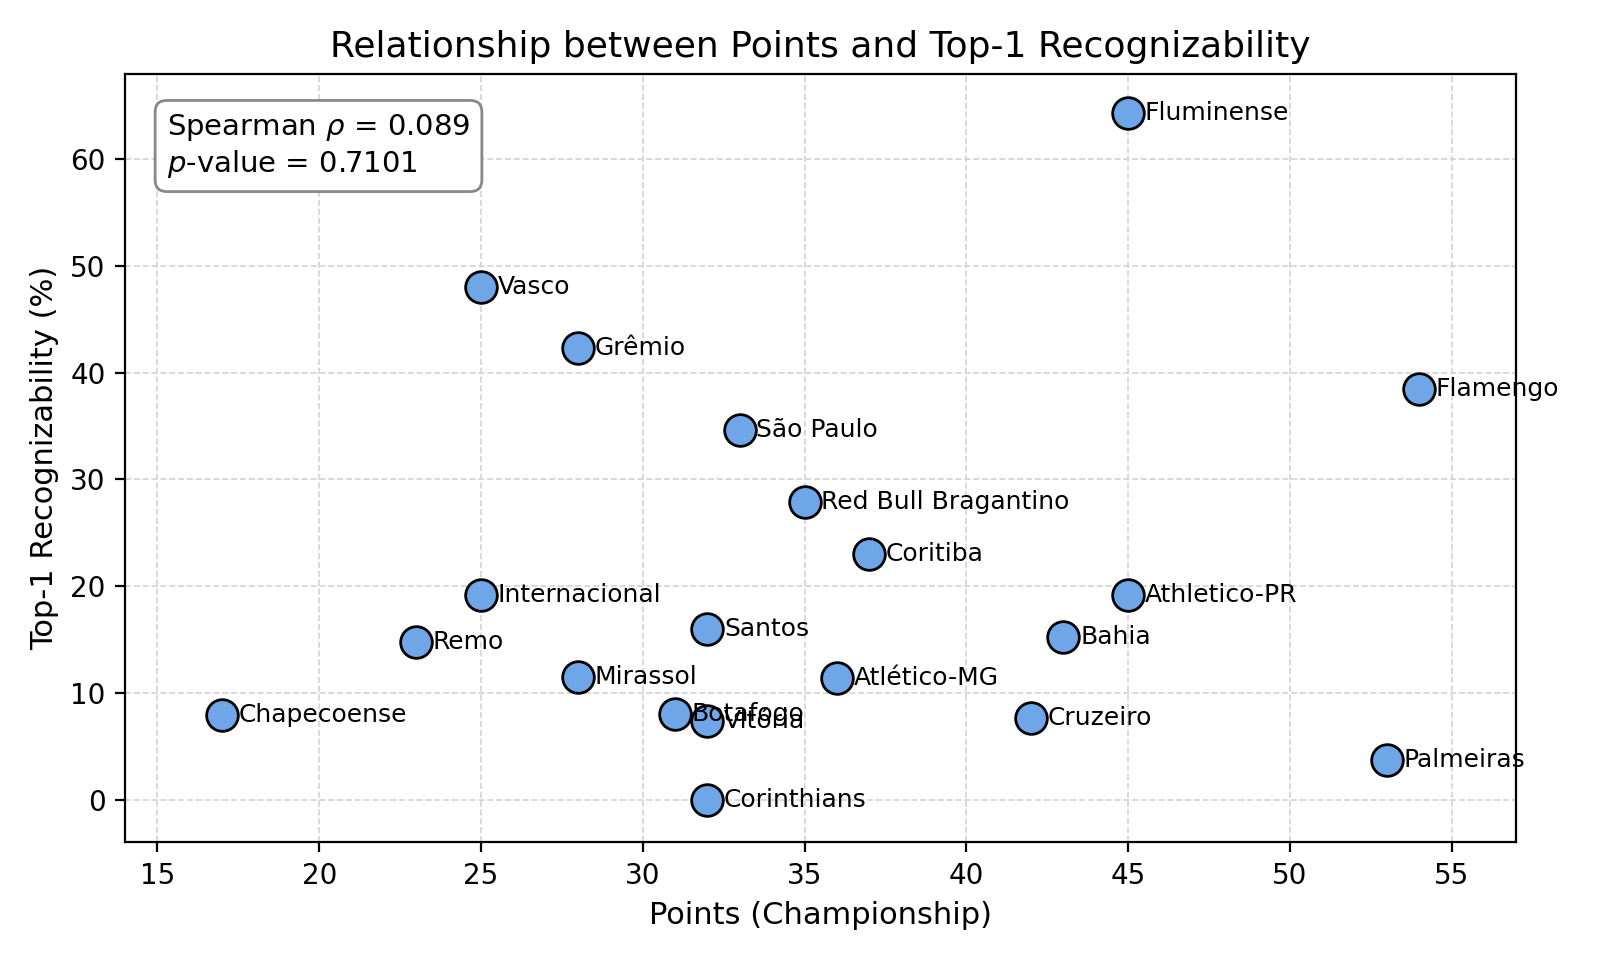
One point deserves attention before any interpretation: style recognizability showed no relationship with league position in our data. Palmeiras, runner-up in this slice of the season, ranks second-lowest in recognizability — ahead of only Corinthians. Vasco da Gama, meanwhile, with a more modest campaign, is among the most recognizable. Having a clear identity is not the same as playing well technically or racking up points: these are distinct properties.
We investigated what explains this variation across clubs and found three associated factors: (i) style distinctiveness — how far the team's centroid sits from the league's average style (ρ = 0.674); (ii) isolation — the distance to the closest rival style (ρ = 0.635); and, to a somewhat lesser degree, (iii) internal stability — how much the team repeats its own pattern from match to match (ρ = 0.506).
In other words: a team is recognizable mainly because it plays differently from everyone else — and, secondarily, because it always plays the same way. Fluminense illustrates this well: its centroid sits at the extreme edge of the league's style space, forming the most distant pair in the whole championship (Fluminense–Red Bull Bragantino), which helps explain why it is so easily recognized.
Enjoy Reading This Article?
Here are some more articles you might like to read next: